Figure 2.

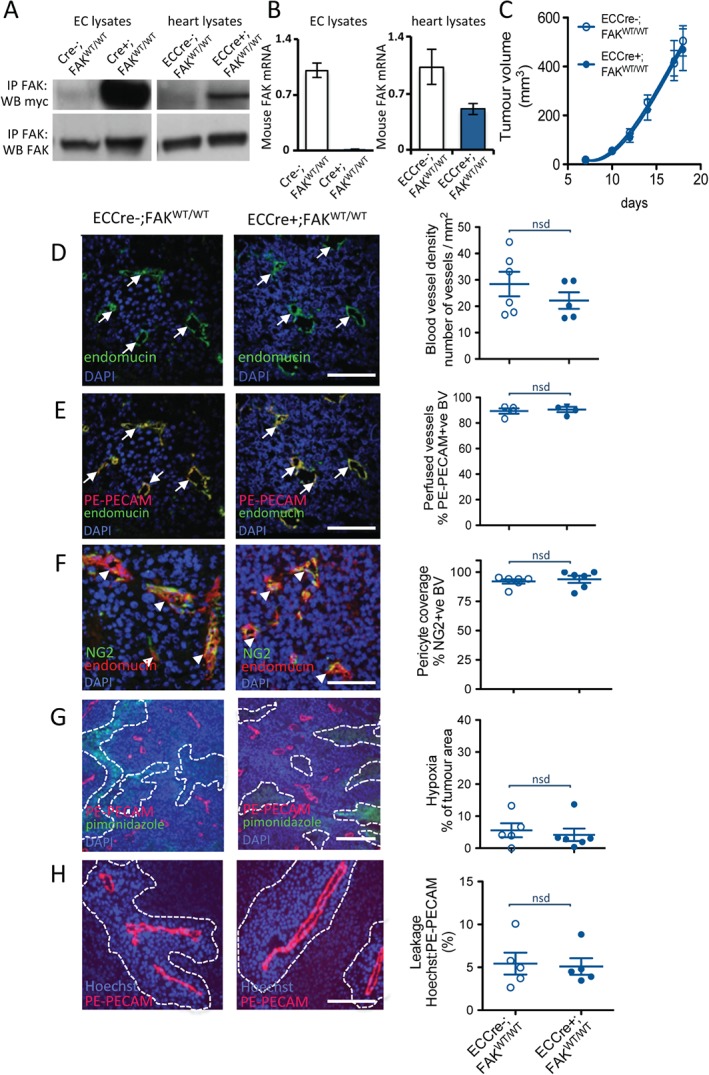
ECCre+;FAKWT/WT mice and ECCre−;FAKWT/WT mice show similar tumour growth and angiogenesis. (A) Immunoprecipitation (IP) for FAK and Western blotting (WB) for the myc‐tag demonstrate increased myc expression in Cre+;FAKWT/WT EC lysates as compared with Cre−;FAKWT/WT control lysates, indicating WT chicken FAK knockin expression in the Cre + ECs. Knockin was also verified in vivo, by similar analysis of fresh heart lysates made from tamoxifen‐treated PdgfbCre+;FAKfl/fl;R26FAKWT/WT (ECCre + FAKWT/WT) mice, but not PgdfbCre−;FAKfl/fl;R26FAKWT/WT (ECCre−;FAKWT/WT) mice. WB for FAK indicated that the knockin was expressed at a similar level to endogenous FAK. The images shown are representative of five experiments. (B) qPCR analysis of mouse FAK shows reduced endogenous mouse FAK mRNA in Cre+;FAKWT/WT EC lysates and ECCre+;FAKWT/WT fresh heart lysates, as compared with Cre − controls. The graphs represent mean values ± standard errors of the mean (SEMs) relative to the glyceraldehyde‐3‐phosphate dehydrogenase gene; n = 5 replicates. (C) Tumour growth was not statistically different between ECCre−;FAKWT/WT and ECCre+;FAKWT/WT mice injected subcutaneously with 1 million B16F0 cells. The graph represents means ± SEMs; n = 13 (ECCre−;FAKWT/WT) and n = 15 (ECCre+;FAKWT/WT). (D–H) Sections of end‐stage tumours grown in ECCre−;FAKWT/WT and ECCre+;FAKWT/WT mice were analysed by immunohistochemistry for: (D) blood vessel density (arrows, endomucin‐positive blood vessels); (E) blood vessel perfusion (arrows, PE‐PECAM/endomucin‐positive blood vessels); (F) pericyte coverage of blood vessels (arrowheads, NG2/endomucin‐positive blood vessels); (G) tumour hypoxia (dotted lines delineate pimonidazole‐positive tumour areas); and (H) blood vessel leakage (dotted lines delineate Hoechst‐positive areas around PE‐PECAM‐positive blood vessels). No significant differences in any of these features was observed between tumours grown in ECCre−;FAKWT/WT and ECCre+;FAKWT/WT mice. Representative immunofluorescence images are shown. Scale bars: 100 µm in (D), (E), (F) and (H); 250 µm in (G). Quantification is given as scatter plots: points represent mean values for each mouse, with means ± SEMs for each genotype. n = 4–6 mice per genotype. BV, blood vessels; DAPI, 4′,6‐diamidino‐2‐phenylindole; nsd, no statistically significant difference.
