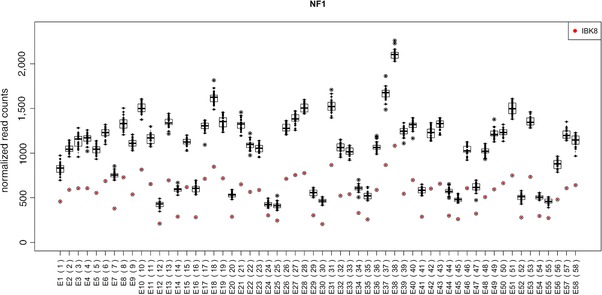
Figure 2.

Boxplot of normalized RCs. The normalized RCs of the test sample and all controls used are displayed as boxplots for each ROI (exons numbered in consecutive order according to BED file) of the NF1 gene. The RCs of each control sample are symbolized by black dots, whereas the RCs of the test sample are highlighted by red dots. The deletion of all ROIs is clearly visible by the red dots that are distinctly below the boxes and whiskers
