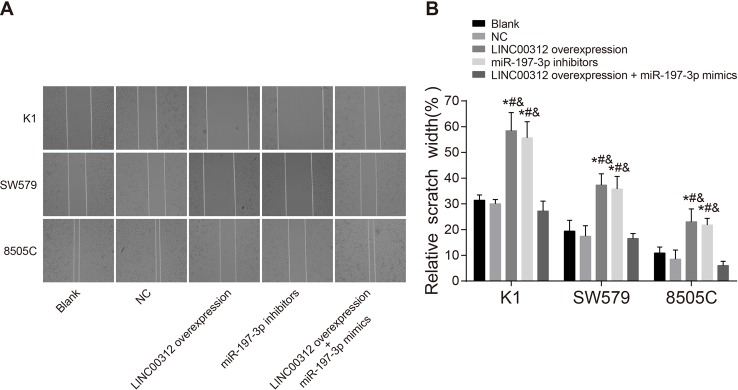
Figure 6. Migration abilities of K1, SW579, and 8505C cells amongst five groups (mean ± S.D.).
(A) Cell migration observed under the optical microscope; (B) histogram of cell scratch width in each group; *, P<0.05, compared with the blank group; #, P<0.05, compared with the NC group; &, P<0.05, compared with the LINC00312 overexpression + miR-197-3p mimics group; four wells of cells in each group were repeated, and the experiment was repeated for three times.

