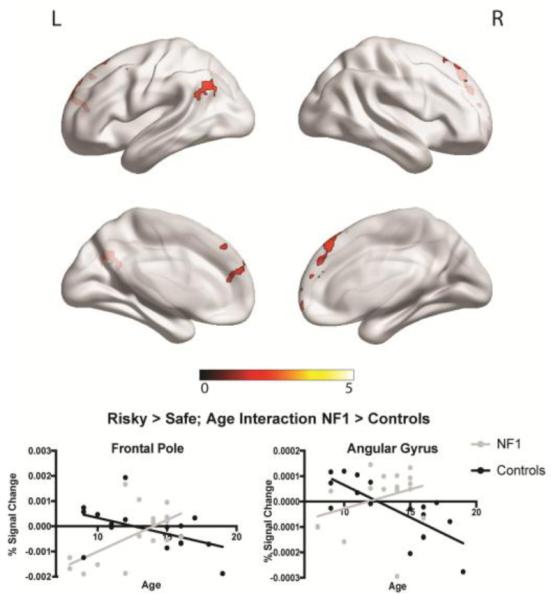
Figure 4.

fMRI results for neural activity during risky vs. safe decision making, and relationship with age. Clusters represent regions that showed a significant group by age interaction effect for risky vs. safe decisions. We found a significant interaction in the middle frontal gyrus and frontal pole, such that controls showed a negative relationship between neural activity and age, whereas patients with NF1 showed increasing neural activity with increasing age. Graphs represent percent signal change. Pearson correlation values: frontal pole: NF1: r=0.60, p=0.01; Controls: r=−0.49, p=0.04; angular gyrus: NF1: r=0.34, p=0.18; Controls: r=−0.76, p<0.01.
