
Figure 1.
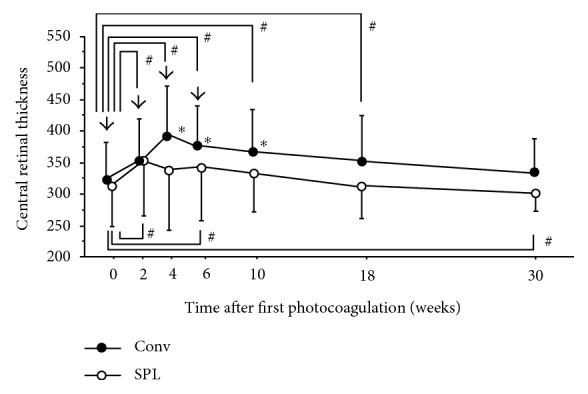
Changes in central retinal thickness (CRT) after four sessions of panretinal photocoagulation (PRP). Data represent mean ± standard deviation (SD). Arrow indicates the timing of PRP. #p < 0.05 (compared with CRT at PRP initiation), ∗p < 0.05 (Conv group versus SPL group).