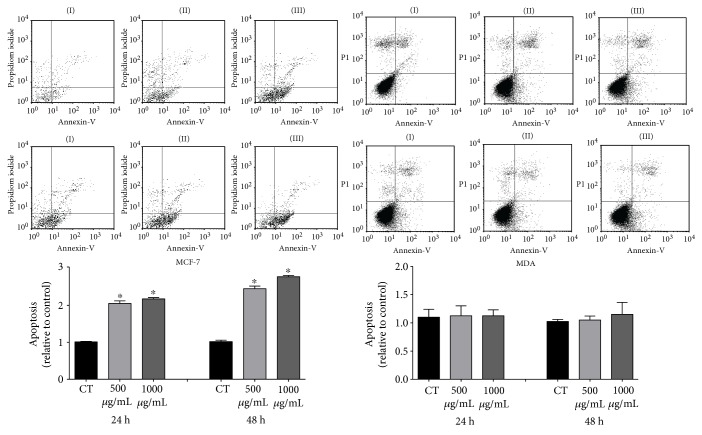
Figure 5.
Detection of apoptotic MDA-MB-435 and MCF-7 cells by flow cytometry under PE stimulation at the concentrations of 500 and 1000 μg/mL for 24 h and 48 h. Data are expressed as mean ± standard deviation relative to the control, of 3 independent experiments, each performed with at least 3 replicates. ∗ indicates significant differences from the control group (∗p = 0.05).

