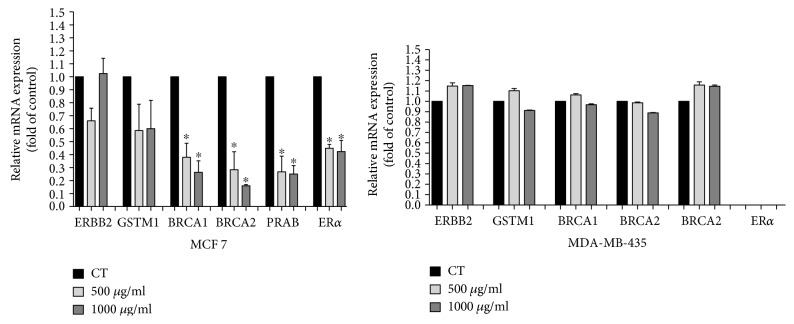
Figure 6.
Profile of gene expression in MCF-7 and MDA-MB-435 cells. Quantitative analysis of real-time PCR in different genes associated with cancer progression, after 48 h incubation with PE. Data are presented as mean ± standard deviation of 3 independent experiments, each performed at least in triplicate. Differences significant between treated cells with PE (500 and 1000 μg/mL) were compared using the Tukey test (∗p < 0.05).

