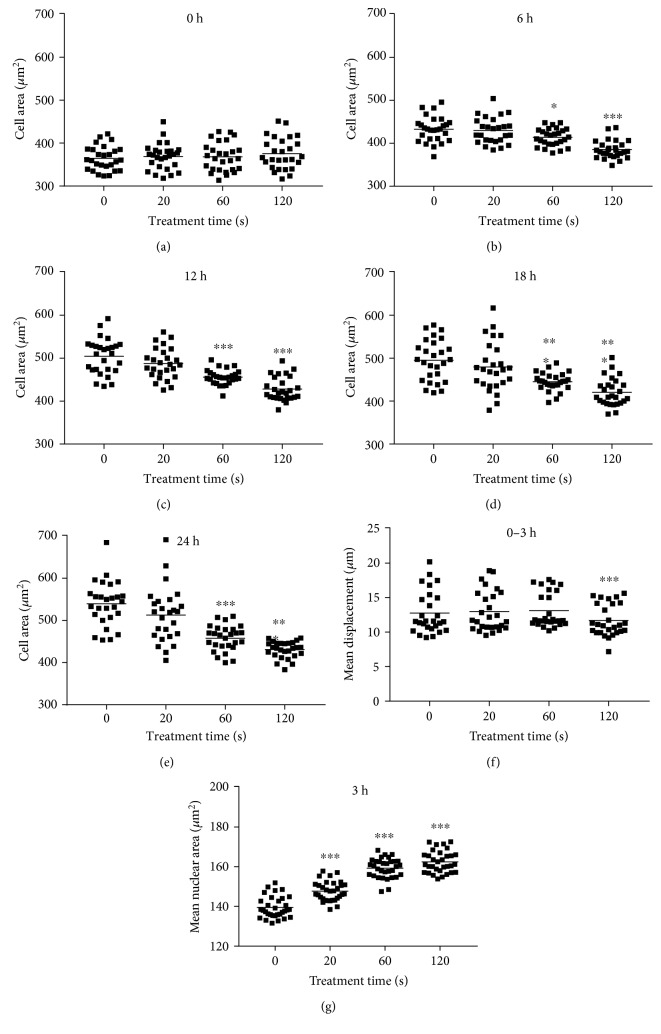
Figure 3.
Melanoma growth kinetic and migration. (a–e) Total cell growth area per field of view was determined after several time points following plasma treatment and using automated image quantification. (f) PI− melanoma motility as a function of mean cell displacement was calculated using time-lapse microscopy over 3 h and kinetic tracking algorithms. (g) Mean nuclear area of cells 3 h after plasma treatment. Data are presented as the mean of 9 replicates of each of the three independent experiments resulting in about 2000 single cells per treatment and time point. Statistical analysis was carried out using one-way ANOVA.

