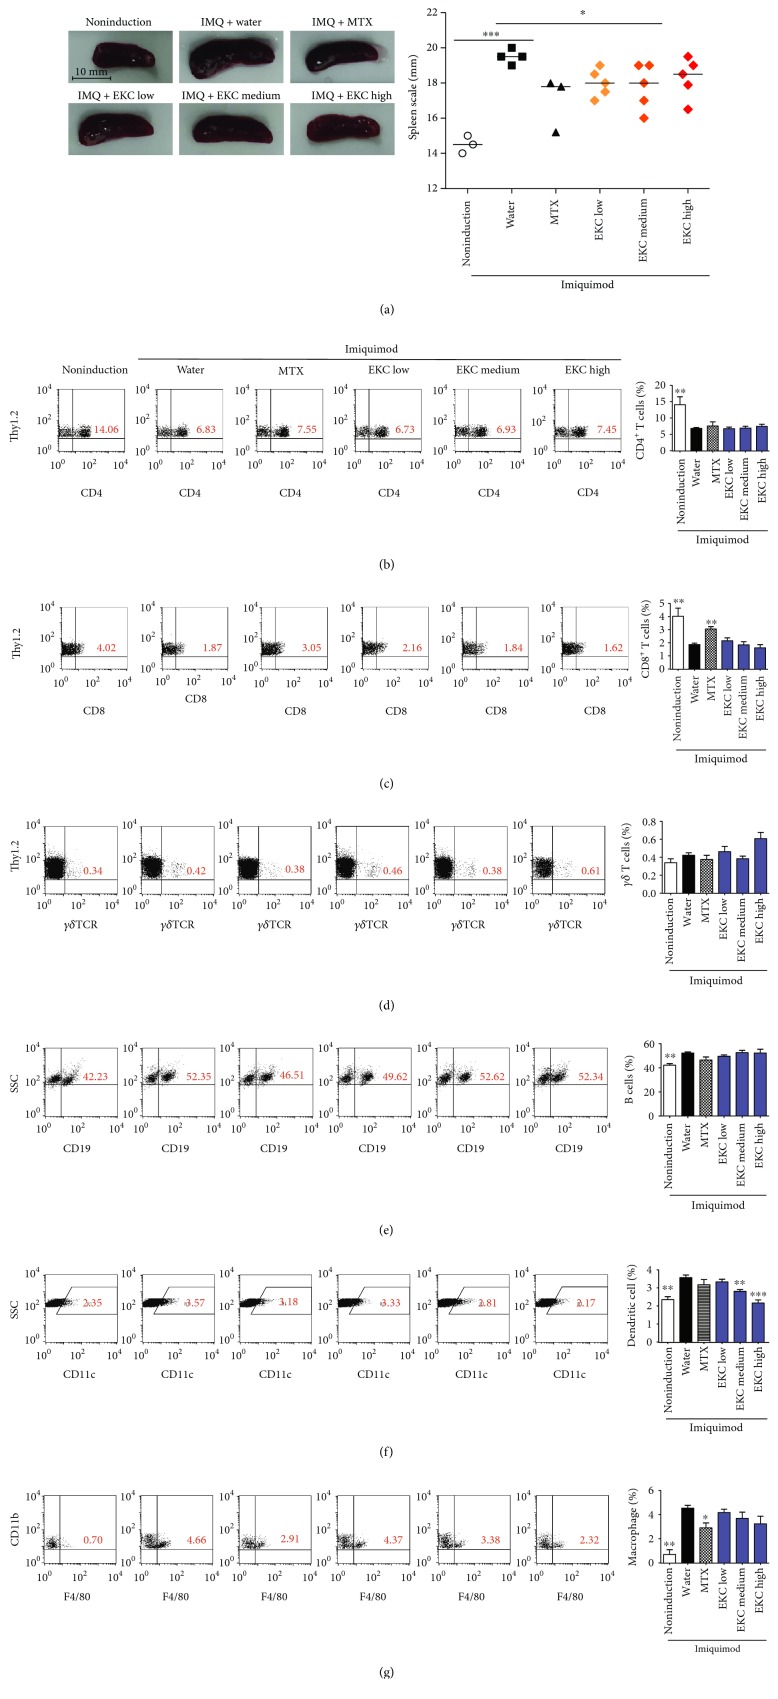
Figure 3.
Effects of EKC on the spleen and analysis of cellular composition. (a) Photographs of the spleen on day 28. Each spleen was measured, and the data presented are the median (n = 5). (b–g) Mice were treated with IMQ or vehicle cream for 7 days consecutively and sacrificed. Splenocytes were analyzed for the percentage of T cells ((b) Thy1.2+CD4+; (c) Thy1.2+CD8+; (d) Th1.2+γδ TCR+; (e) B cells [CD19+]; (f) dendritic cells [CD11c+]; and (g) macrophages [F4/80+CD11b+]) by flow cytometry. Numbers indicate the mean percentage of cells present within a quadrant or gate (n = 5 mice/group). Graphs are presented as the mean ± SD (n = 5). ∗p < 0.05; ∗∗p < 0.01; and ∗∗∗p < 0.001 compared with imiquimod + water group.

