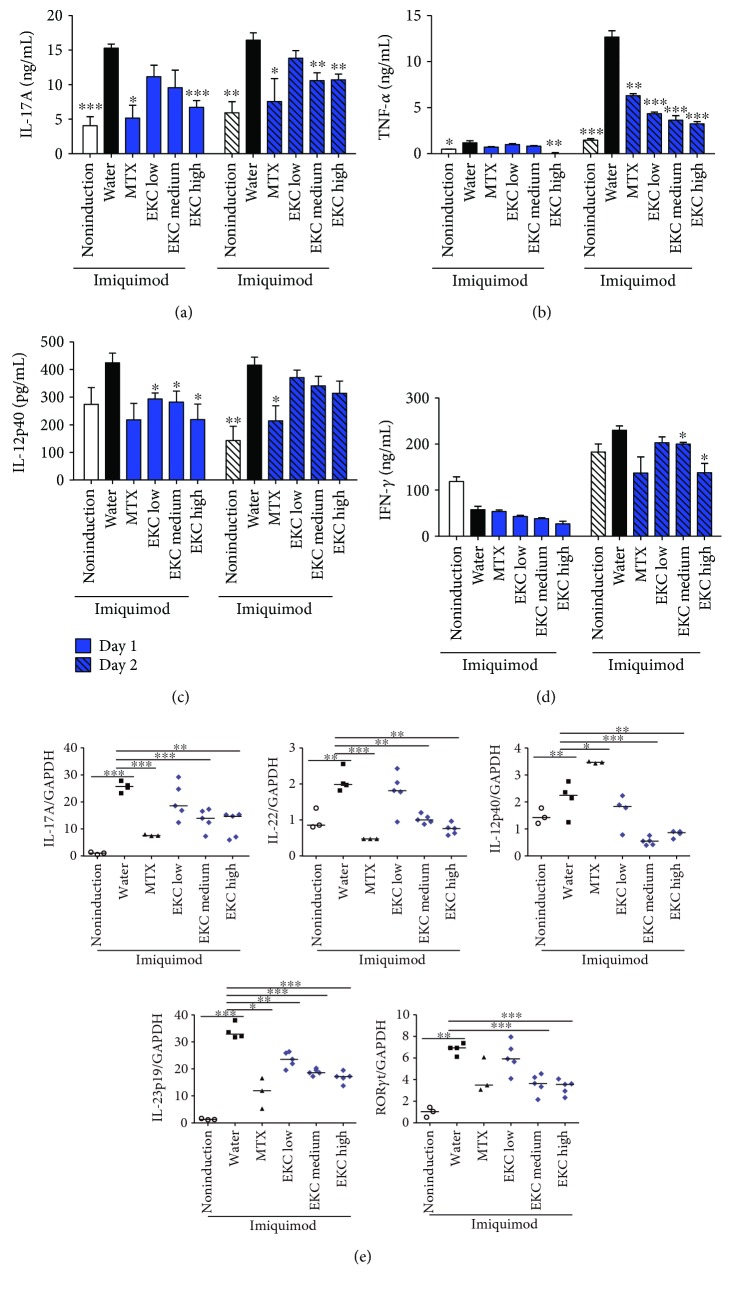
Figure 4.
Effects of oral administration of EKC in splenocytes. (a–d) Spleen cells were purified from mice on day 28, stimulated with anti-CD3 Ab for 24 h and 48 h, and the cytokine levels were measured by ELISA. Values represent the mean ± SD. (e) Spleen cells were purified from mice on day 28 and stimulated with anti-CD3 Ab for 2 days. Total mRNA was extracted, and the levels of IL-17A, IL-22, IL-23p19, IL-12p40, and RORγt were evaluated by real-time PCR. Values represent the median. ∗p < 0.05; ∗∗p < 0.01; and ∗∗∗p < 0.001 compared with the imiquimod + water group.

