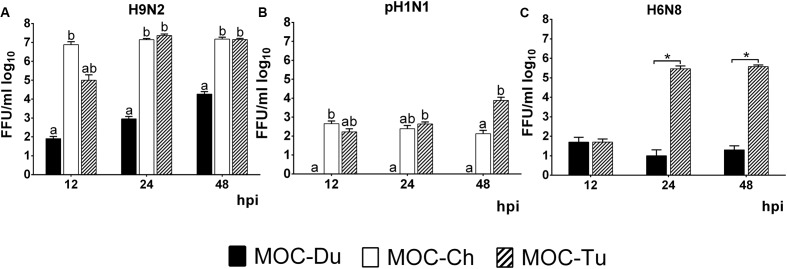
FIGURE 3.
Quantification of H9N2 (A), pH1N1 (B), and H6N8 (C) in MOC of Pekin duck (Du), chicken (Ch), and turkey (Tu) by FFU (Experiments 1 and 3). MOC were infected with H9N2 (A), pH1N1 (B) or H6N8 (C) (infectious dose of 104FFU/explant). Supernatants were collected at 12, 24, and 48 hpi and were subjected to viral titration with the FFU. Results are presented in FFU/ml log10. Virus-free controls were negative at all investigated time points (n = 5 MOC/group/time point). Different letters indicate differences between groups tested at the same time point post infection p < 0.05, ANOVA, Tukey honestly significant differences (HSD). Error bars indicate standard deviation (SD). (∗) indicates statistical significance differences between MOC-Tu and MOC-Ch p < 0.05, Wilcoxon Rank-Sum Test. A representative repeat of one experiment is shown.

