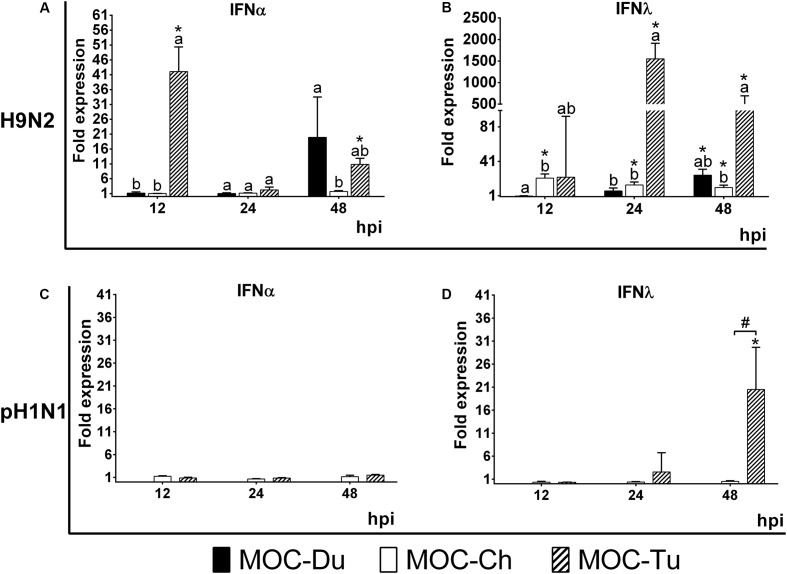
FIGURE 4.
Interferon (IFN) α (A,C) and λ (B,D) mRNA expression in MOC of Pekin duck (Du), chicken (Ch), and turkey (Tu) after infection with H9N2 (A,B) and pH1N1 (C,D) (Experiment 2). IFNα and IFNλ mRNA expression of infected MOC are presented in fold-change compared to the respective virus-free controls. MOC were collected at 12, 24 and 48 hpi and processed for RNA isolation and quantification of IFNα and IFNλ mRNA expression by qRT-PCR. pH1N1-infected MOC-Du were not susceptible to infection as demonstrated by FFU and antigen detection by immunofluorescence, therefore no IFN quantification of was conducted. Values were normalized to 28S rRNA expression (Petersen et al., 2013) (n = 5 MOC/group/time point). MOC had been infected with pH1N1 and H9N2 with an infectious dose of 104 FFU/explant. Different letters indicate differences between groups tested at the same time point post infection p < 0.05, Kruskal–Wallis All-Pairwise Comparisons Test. (∗) indicate statistical significance between virus-infected and virus-free controls p < 0.05, two sample T-test. (#) indicates statistical significance between MOC-Tu and MOC-Ch p < 0.05, two sample T-test. Error bars indicate SD. A representative repeat of Experiment 2 is shown.

