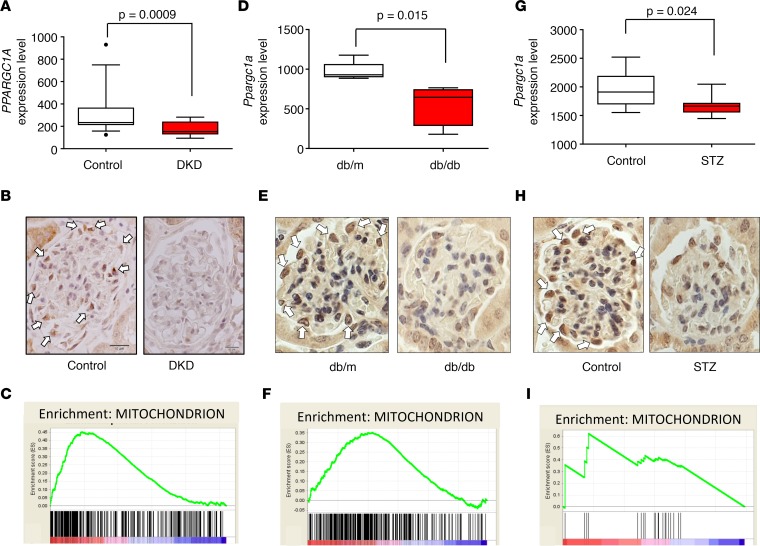
Figure 1. Glomerular PGC1α expression and mitochondrial transcript abundance in diabetic glomeruli.
(A) Glomerular PPARGC1A expression in diabetic kidney disease patients and controls. Box-and-whisker plots depict the median (line within box), 2.5–97.5 percentile (whiskers), and first and third quartiles (bottom and top of box) (n = 21). Significance evaluated by unpaired t test. (B) Representative PGC1α immunostaining of human kidneys. Arrows indicate positive PGC1α staining in podocytes of control samples. Scale bars: 10 μm. (C) Gene set enrichment analysis shows that mitochondrial gene transcript abundance is lower in diabetic human glomeruli compared with control samples. (D) Glomerular Ppargc1a mRNA expression level in db/db and control mice (n = 10). (E) Representative PGC1α immunostaining of db/db and control mice. (F) Gene set enrichment analysis of mitochondrial gene transcript abundance in glomeruli of db/db and control mice. (G) Glomerular Ppargc1a mRNA expression level in streptozotocin-injected and control mice (n = 17). (H) Representative PGC1α immunostaining in streptozotocin-injected and control mice. (I) Gene set enrichment analysis of mitochondrial gene transcript abundance in glomeruli of streptozotocin-injected and control mice. PGC1α, peroxisome proliferator-activated receptor γ coactivator-1α; DKD, diabetic kidney disease; STZ, streptozotocin.

