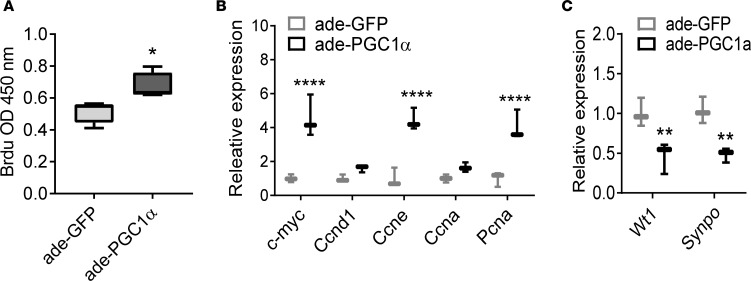
Figure 6. PGC1α induces podocyte proliferation in vitro.
(A) BrdU incorporation in cultured podocytes following control (GFP) and PGC1α adenoviral infection (n = 10 per group). Box-and-whisker plots depict the median (line within box), upper and lower quartiles (bounds of box), and minimum and maximum values (whickers). **P < 0.01 by Student’s t test. (B) Expression of genes involved in cell proliferation in control and PGC1α-expressing podocytes. c-Myc, cyclin D1 (Ccnd1), cyclin E (Ccne), cyclin A (Ccna), and proliferating cell nuclear antigen (Pcna) were evaluated. (C) Podocyte-specific gene expression in control and PGC1α-expressing podocytes. Wilms tumor 1 (Wt1) and synaptopodin (Synpo) were evaluated.*P ≤ 0.05, **P ≤ 0.01 by unpaired t test with Bonferroni correction. Ade, adenovirus; PGC1α, peroxisome proliferator-activated receptor γ coactivator-1α.

