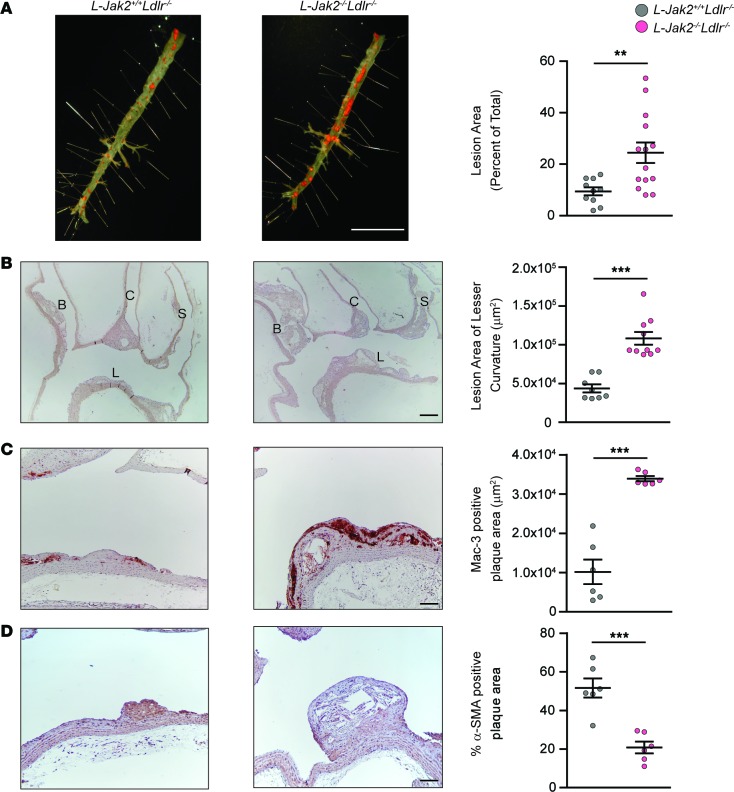
Figure 4. L-Jak2–/–Ldlr–/– mice exhibited increased atherosclerotic plaque burden with increased macrophage and decreased smooth muscle cell content.
Ldlr-null mice with hepatic Jak2 deficiency (L-Jak2–/–Ldlr–/–) and littermate controls (L-Jak2+/+Ldlr–/–) were fed an atherogenic diet containing 1.25% cholesterol for 12 weeks, starting at 6 weeks of age. (A) Representative photographs of en face oil red O (ORO) staining and quantification of atherosclerotic plaque area in descending aortas of L-Jak2–/–Ldlr–/– mice (n = 14) and control L-Jak2+/+Ldlr–/– mice (n = 10). Scale bar: 1 cm. (B) Representative images of longitudinal sections from the aortic arch of L-Jak2–/–Ldlr–/– mice (n = 10) and control L-Jak2+/+Ldlr–/– mice (n = 8) stained with H&E and quantification of lesion size at the lesser curvature. B, brachiocephalic artery; C, left common carotid; S, subclavian artery; L, lesser curvature. Scale bar: 200 μm. (C and D) Representative images of the lesser curvature of longitudinal aortic arch sections from L-Jak2–/–Ldlr–/– mice (n = 6) and control L-Jak2+/+Ldlr–/– mice (n = 6) immunostained with antibody against Mac-3 and α-smooth muscle actin (α-SMA) and quantification of positively stained area expressed as an absolute number or percentage. Scale bars: 100 μm. In each of the panels, each dot in the scatter plot indicates an individual animal. Data represent mean ± SEM. Differences between groups were analyzed for statistical significance by Student unpaired t test. **P < 0.01, ***P < 0.001.

