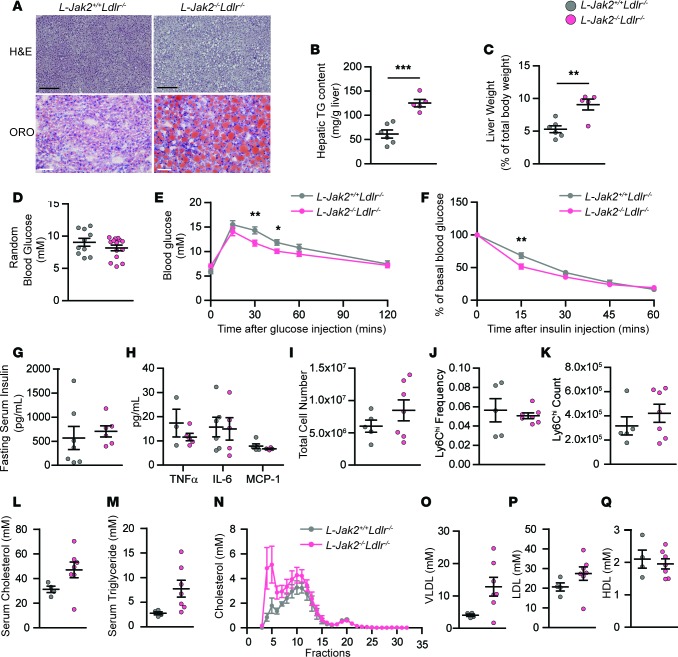
Figure 5. L-Jak2–/–Ldlr–/– mice develop profound hepatic steatosis but do not display glucose intolerance, insulin resistance, or systemic inflammation.
L-Jak2–/–Ldlr–/– mice and L-Jak2+/+Ldlr–/– littermate controls were fed an atherogenic diet containing 1.25% cholesterol for 12 weeks, starting at 6 weeks of age. (A) Representative images of H&E and oil red O (ORO) staining of liver sections from L-Jak2–/–Ldlr–/– mice (n = 9 and 5) and control L-Jak2+/+Ldlr–/– mice (n = 6 and 4). Scale bars: 300 μm (black), 50 μm (white). (B) Total hepatic triglyceride (TG) content in L-Jak2–/–Ldlr–/– mice (n = 5) and control L-Jak2+/+Ldlr–/– mice (n = 6). Results are normalized to tissue weight. (C) Liver weight normalized to total body weight in L-Jak2–/–Ldlr–/– mice (n = 5) and control L-Jak2+/+Ldlr–/– mice (n = 6). (D) Random blood glucose from L-Jak2–/–Ldlr–/– mice (n = 14) and control L-Jak2+/+Ldlr–/– mice (n = 10). (E) Glucose tolerance test in overnight-fasted L-Jak2–/–Ldlr–/– mice (n = 15) and control L-Jak2+/+Ldlr–/– mice (n = 11). Mice received glucose (1 g/kg) i.p., and blood glucose was measured sequentially for 120 minutes. (F) Insulin tolerance test in 4 hour–fasted L-Jak2–/–Ldlr–/– mice (n = 16) and control L-Jak2+/+Ldlr–/– mice (n = 11). Mice received insulin (0.75 units/kg) i.p., and blood glucose was measured sequentially for 60 minutes. Data are expressed as a percentage of basal (fasting) glucose. (G) Fasting serum insulin levels from L-Jak2–/–Ldlr–/– mice (n = 6) and control L-Jak2+/+Ldlr–/– mice (n = 7). (H) Serum levels of TNFα, IL-6, and MCP-1 in L-Jak2–/–Ldlr–/– mice (n = 4–5) and control L-Jak2+/+Ldlr–/– mice (n = 3–6). MCP-1, monocyte chemoattractant protein-1. (I) Total number of leukocytes in blood from L-Jak2–/–Ldlr–/– mice (n = 7) and control L-Jak2+/+Ldlr–/– mice (n = 5). (J and K) Frequency and absolute numbers of Ly6Chi monocytes in red cell–lysed blood from L-Jak2–/–Ldlr–/– mice (n = 7) and control L-Jak2+/+Ldlr–/– mice (n = 5) using flow cytometry. Ly6Chi monocytes were defined based on CD115+Ly6ChiLy6G– expression. Total serum (L) cholesterol; P = 0.1061 and (M) triglycerides from L-Jak2–/–Ldlr–/– mice (n = 7) and control L-Jak2+/+Ldlr–/– mice (n = 4). (N–Q) Distribution of serum cholesterol among lipoprotein fractions determined by fast performance liquid chromatography (FPLC) and total serum VLDL, LDL, and HDL cholesterol were quantified from FPLC serum lipoprotein profiles from L-Jak2–/–Ldlr–/– mice (n = 7) and control L-Jak2+/+Ldlr–/– mice (n = 4). Each dot in scatter plots indicate an individual animal. Data represent mean ± SEM. Differences between groups were analyzed for statistical significance by Student unpaired t test. *P < 0.05, **P < 0.01, ***P < 0.001.

