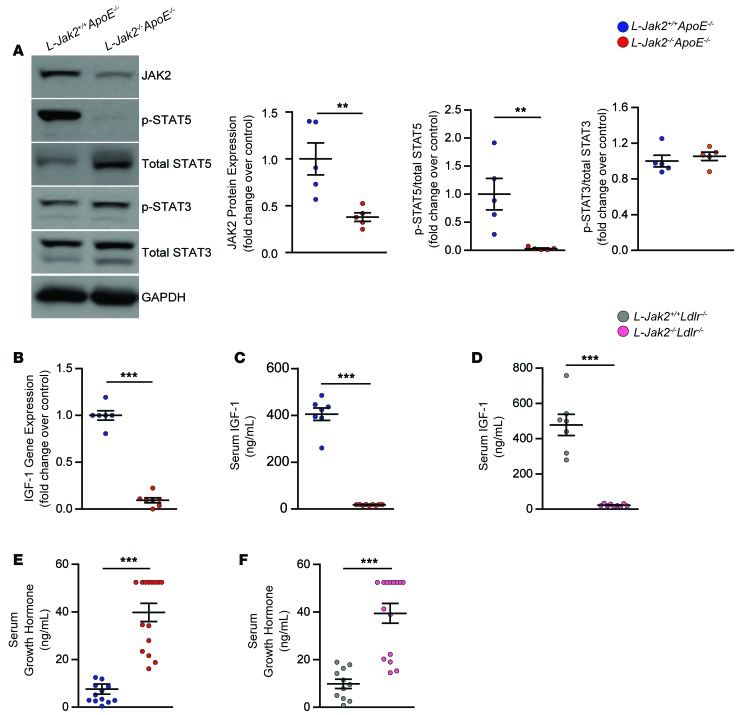
Figure 6. L-Jak2–/–ApoE–/– and L-Jak2–/–Ldlr–/– mice exhibit impaired hepatic growth hormone signaling.
L-Jak2–/–ApoE–/–, L-Jak2–/–Ldlr–/–, and littermate controls (L-Jak2+/+ApoE–/– or L-Jak2+/+Ldlr–/–, respectively) were fed an atherogenic diet containing either 0.2% cholesterol (for ApoE-null mice) or 1.25% cholesterol (for Ldlr-null mice) for 12 weeks, starting at 6 weeks of age. (A) Western blots and quantitative summary of JAK2, phospho-STAT5, total STAT5, phospho-STAT3, and total STAT3 in liver homogenates from L-Jak2–/–ApoE–/– mice (n = 5) and control L-Jak2+/+ApoE–/– mice (n = 5). Protein band intensity was quantified by ImageJ software, and levels of JAK2 were normalized to expression of GAPDH; levels of p-STAT5 and p-STAT3 were normalized first to expression of GAPDH and then normalized to expression of total STAT5 and STAT3, respectively. Values are presented as fold change over control group. (B) Quantitative PCR (qPCR) analysis of Igf1 mRNA expression in livers from L-Jak2–/–ApoE–/– mice (n = 7) and control L-Jak2+/+ApoE–/– mice (n = 6). Values are normalized to 18S mRNA levels and presented as fold change over control group. (C) Serum levels of IGF-1 measured in L-Jak2–/–ApoE–/– mice (n = 9) and control L-Jak2+/+ApoE–/– mice (n = 7). (D) Serum levels of IGF-1 measured in L-Jak2–/–Ldlr–/– mice (n = 9) and control L-Jak2+/+Ldlr–/– mice (n = 7). (E) Serum levels of growth hormone (GH) measured in L-Jak2–/–ApoE–/– mice (n = 15) and control L-Jak2+/+ApoE–/– mice (n = 12). (F) Serum levels of GH measured in L-Jak2–/–Ldlr–/– mice (n = 15) and control L-Jak2+/+Ldlr–/– mice (n = 11). In each of the panels, each dot in the scatter plot indicates an individual animal. Data represent mean ± SEM. Differences between groups were analyzed for statistical significance by Student unpaired t test. **P < 0.01, ***P < 0.001.

