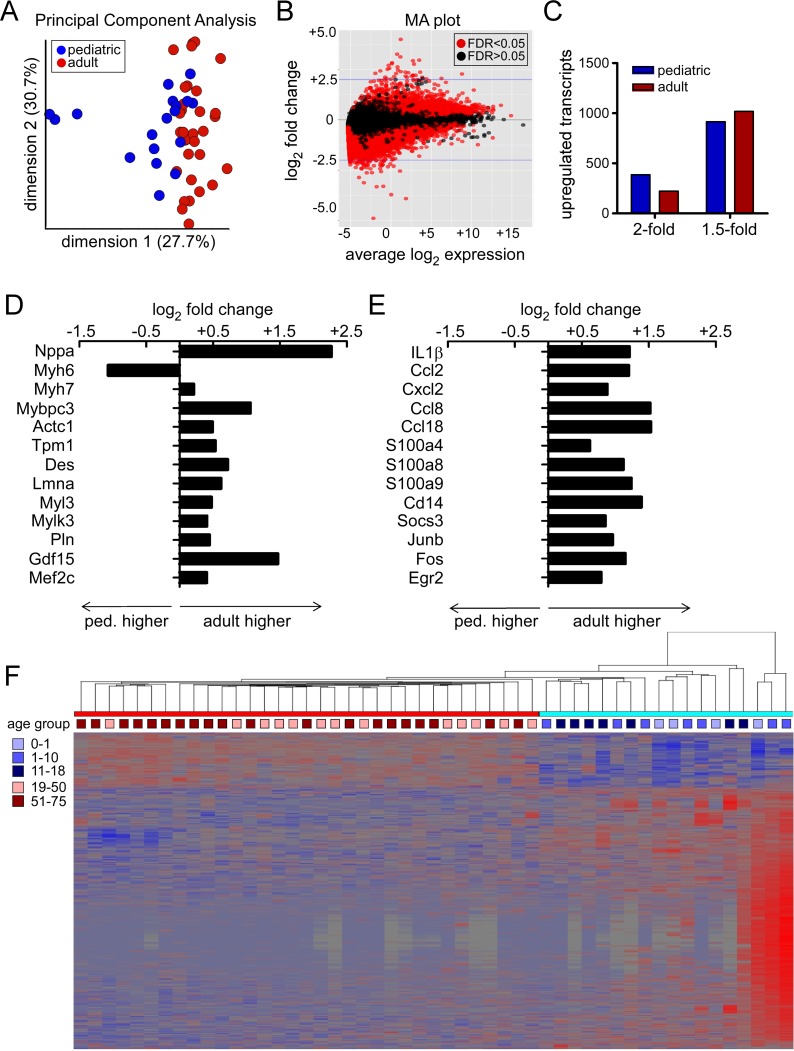
Figure 6. RNA sequencing analysis.
(A) Principal component analysis demonstrating segregation of pediatric and adult DCM samples. (B) Bland-Altman (MA) plot depicting the relationship between differential gene expression and transcript abundance in pediatric and adult DCM samples. (C) Differential gene expression analysis highlighting the number of mRNA transcripts that are differentially expressed by 1.5- and 2-fold in pediatric and adult DCM samples. (D and E) mRNA transcripts associated with sarcomere remodeling (D) and inflammation (E) are differentially regulated in pediatric and adult DCM. (F) Hierarchical clustering analysis illustrating that pediatric and adult DCM samples cluster as two distinct entities rather than as a continuum of age. Ped, pediatric.

