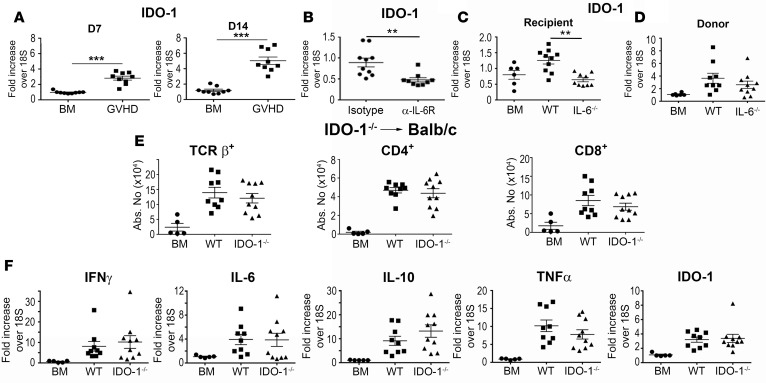
Figure 6. Donor IDO-1 production does not impact inflammation in the brain during graft-versus-host disease (GVHD).
IDO-1 mRNA expression in the brains of BALB/c mice transplanted with B6 bone marrow (BM) alone (●, n = 9) or B6 BM and B6 spleen cells (■, n = 9) 7 and 14 days after transplantation. (B) IDO-1 mRNA expression in the brains of BALB/c recipient mice treated with either an isotype control (●, n = 10) or the anti–IL-6 receptor (α–IL-6R) antibody (■, n = 9) on days 0 and 7, and then assessed 14 days after transplantation. (C) IDO-1 mRNA expression in the brains of B6 (■, n = 10) or IL-6–/– animals transplanted with B10.BR BM and spleen cells (adjusted to a dose of 4.5 × 10⁶ αβ T cells) (▲, n = 9). B6 (●, n = 6) mice reconstituted with B10.BR BM alone served as controls. (D) IDO-1 mRNA expression in the brains of BALB/c mice transplanted with either B6 (■, n = 9) or IL-6–/– BM and spleen cells (▲, n = 10). BALB/c mice reconstituted with B6 BM alone served as controls (●, n = 6). (E) BALB/c mice transplanted with B6 BM alone (●, n = 5), B6 BM and spleen cells (■, n = 9), or IDO-1–/– BM and spleen cells (▲, n = 10). The absolute number of donor-derived TCR+, CD4+, and CD8+ T cells in the brain 14 days after transplantation is depicted. (F). IFN-γ, IL-6, IL-10, TNF-α, and IDO-1 mRNA expression in the brains of BALB/c mice transplanted with B6 BM alone (●, n = 5), B6 BM and spleen cells (■, n = 10), or IL-6–/– BM and spleen cells (▲, n = 10) on day 14. Statistically significant differences were calculated using the 2-tailed Mann-Whitney U test and the 2-way ANOVA followed by Student’s t test. **P < 0.01, ***P < 0.001.

