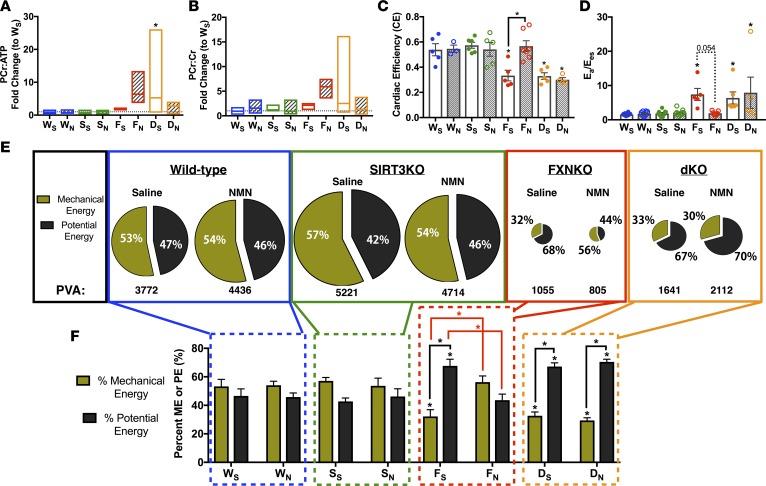
Figure 4. NMN reduces energy wasting and improves energy utilization in the FXN-KO heart.
(A and B) High-energy phosphate-bearing metabolite ratios, PCr/Cr (A) and PCr/ATP (B). Bar line represents sample mean (n = 3–5 mice/group). (C) Cardiac efficiency and (D) ventriculoarterial energy transfer ratio. Ea, effective arterial elastance; Ees, ventricular end-systolic elastance. Values are means ± SEM (n = 5–12 mice/group). (E) Energy contribution diagrams (n = 5–12 mice/group). Mechanical energy (olive green) and potential energy (dark brown) contribute to overall available energy (PVA). (F) Quantification of the energy contribution diagrams in E. *P < 0.05, difference from saline-treated WT as determined by two-way ANOVA for 8 groups (4 genotypes, 2 treatment) and Bonferroni correction. W, WT; F, FXN-KO; S, SIRT3-KO; D, dKO; subscript S, saline; and subscript N, NMN.

