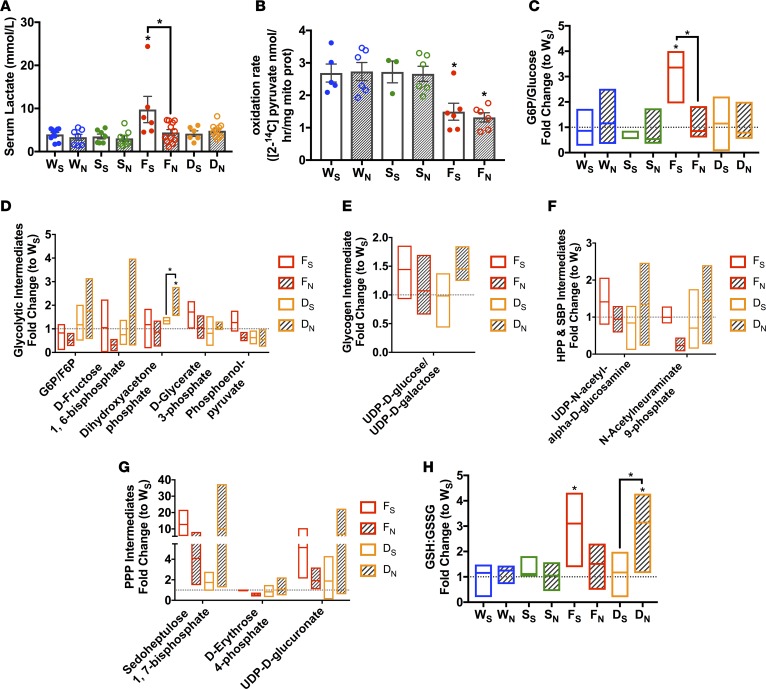
Figure 6. NMN glucose utilization in the FXN-KO mouse in a SIRT3-dependnet manner.
(A) Serum lactate levels. Values are means ± SEM (n = 6–12 mice/group). (B) 2-14C-pyruvate oxidation measured in cardiac tissue lysates. Values are means ± SEM (n = 3–6 mice/group). (C–H) Metabolomic profiling from cardiac tissue of metabolites involved in glucose metabolism. Ratio of glucose committed to glucose metabolism in the heart (G6P/glucose ratio, C), glycolysis intermediates (D), glycogen intermediate (E), hexosamine biosynthesis pathway (HBP) and sialic acid biosynthesis pathway (SBP) intermediates (F), pentose phosphate pathway (PPP) intermediates (G), and glutathione/GSSG ratio (H). Bar line represents sample mean (n = 3–5 mice/group). *P < 0.05, difference from saline-treated WT as determined by two-way ANOVA for 8 groups (4 genotypes, 2 treatment) and Bonferroni correction. W, WT; F, FXN-KO; S, SIRT3-KO; D, dKO; subscript S, saline; and subscript N, NMN.

