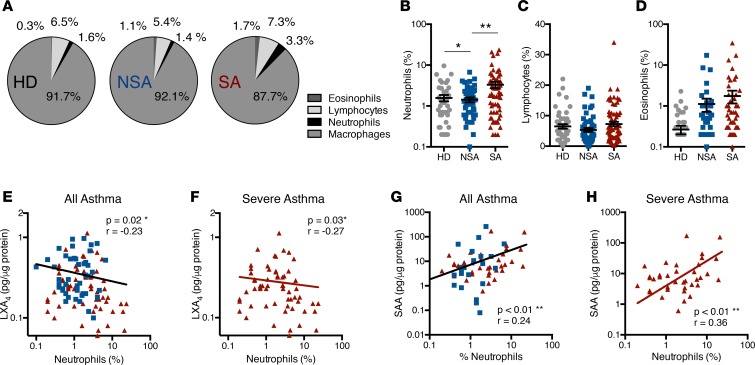
Figure 3. BAL neutrophils are increased in severe asthma and differentially related to BALF LXA4 and SAA levels.
BAL samples were obtained from NSA and SA subjects and leukocyte subsets were enumerated. (A) Pie charts express the mean percentage of BAL neutrophils, lymphocytes, eosinophils, and macrophages in n = 47 HD, n = 51 NSA, and n = 69 SA subjects. (B–D) Scatter plots show individual subject data points with mean ± SEM for BAL (B) neutrophils, (C) lymphocytes, and (D) eosinophils in the HD (gray circles), NSA (blue squares), and SA (red triangles) cohorts. *P < 0.05, **P < 0.01 by 1-way ANOVA. (E and F) The relationship between BALF neutrophils and LXA4 was determined for (E) all asthma subjects and (F) for the SA cohort only. (G and H) The relationship between BALF neutrophils and SAA was determined for (G) all asthma subjects and (H) for the SA cohort only. SAA levels that were undetectable were assigned a value of 0 pg/μg protein and were included in the correlation analysis. Pearson correlation r value and significance are noted and regression lines are shown. BALF, bronchoalveolar lavage fluid; HD, healthy donors; NSA, nonsevere asthma; SA, severe asthma; LXA4, lipoxin A4; SAA, serum amyloid A.

