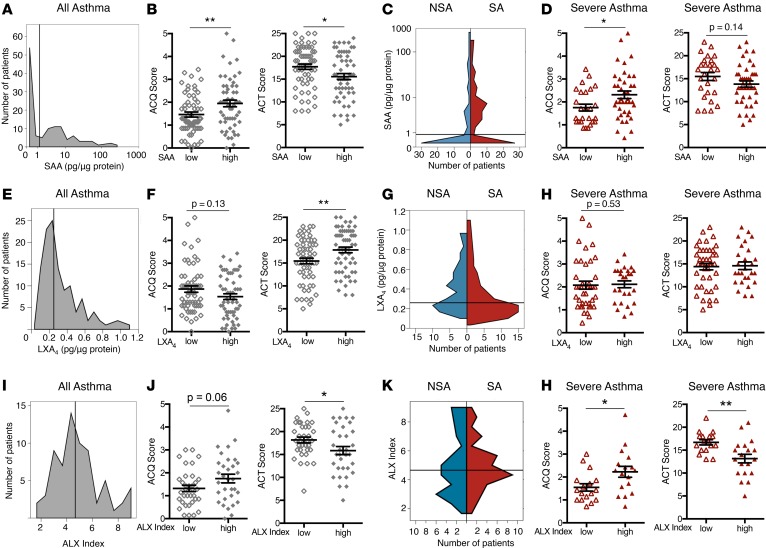
Figure 4. SAA and macrophage ALX expression are associated with increased symptoms in severe asthma.
Asthma subjects were categorized into subgroups based on low or high BALF levels of SAA (A–D), LXA4 (E–H), and macrophage ALX expression (I–L). The median value for each variable was used to define the cutoff between the low and high subgroups (SAA cutoff = 1.22 pg/μg protein, LXA4 cutoff = 0.25 pg/μg protein, ALX index cutoff = 4.6 pg/μg protein). Cutoff values are delineated by the gray vertical line. A histogram shows the distribution of subjects based on BALF (A) SAA level, (E) LXA4 level, and (I) BAL macrophage ALX index. (B, F, and J) Validated measures of asthma symptoms (ACQ and ACT scores) were compared between low (open diamonds) and high (closed diamonds) subgroups for SAA, LXA4, and ALX index. (C, G, and K) The distributions of SAA, LXA4, and ALX index among NSA (blue) and SA (red) subjects are shown in violin plots. (D, H, and L) ACQ and ACT scores were compared in SA subjects for low (open triangles) and high (closed triangles) subgroups for SAA, LXA4, and ALX index. Scatter plots show individual subject data with mean ± SEM. n = 51 NSA and n = 69 SA subjects.*P < 0.05, **P < 0.01 by Mann-Whitney test or 2-tailed Student’s t test. BALF, bronchoalveolar lavage fluid; SAA, serum amyloid A; ACQ, asthma control questionnaire; ACT, asthma control test; NSA, nonsevere asthma; SA, severe asthma; LXA4, lipoxin A4; ALX, airway lipoxin A4 receptor.

