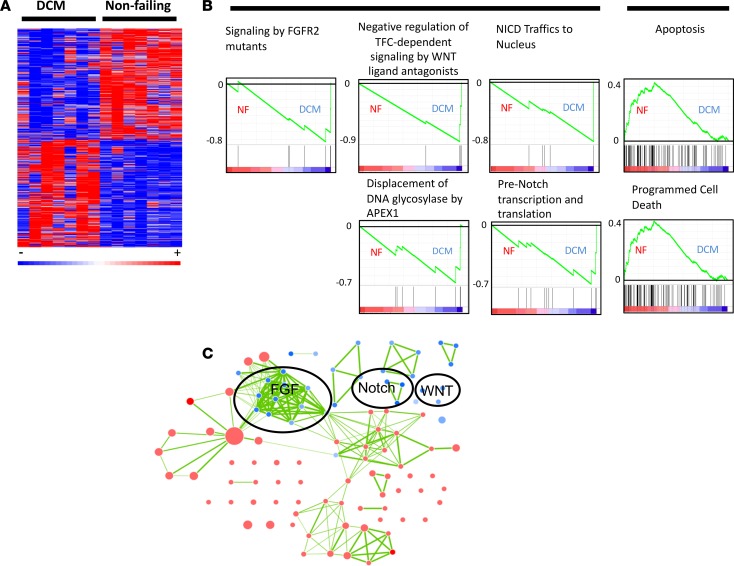
Figure 1. Transcriptome profile of pediatric dilated cardiomyopathy (DCM) patients (n = 7 DCM and 7 nonfailing [NF] pediatric hearts).
(A) Heatmap of the 1,260 significantly changed genes (two-sided Wilcox rank-sum t test, P ≤ 0.05). (B) GSEA enrichment profiles in DCM patients and NF controls. These profiles highlight the influence of a small cohort of genes involved in FGF, WNT, and NOTCH signaling in DCM patients (heatmaps of enriched genes are provided in Supplemental Figure 1). Genes are represented by vertical bars, and enrichment is represented by a green line. (C) Cytoscape network of the significantly enriched pathways in both DCM and NF patients. Blue represents pathways associated with DCM patients, and red represents pathways associated with NF controls. Each node represents a single enriched pathway, and each link represents a gene common between pathways. The network accentuates the high degree of crosstalk between enriched pathways.

