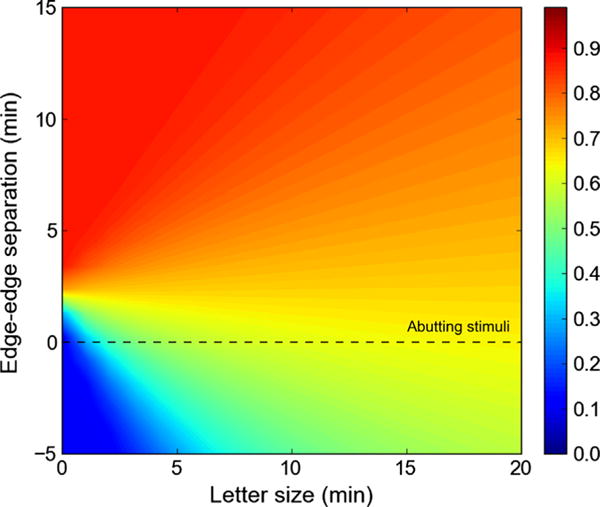
Fig. 3.

The full grid of predicted percent correct performance values extrapolated from the psychometric functions fitted to the data Siderov, Waugh, and Bedell (2013). Each point on the grid indicates a single letter size (x-axis) at a given edge-to-edge separation (y-axis). A full predicted psychometric function can be read from bottom to top for a given letter size. The dashed line indicates the ordinate where target and flanker abut (edge-to-edge spacing is zero).
