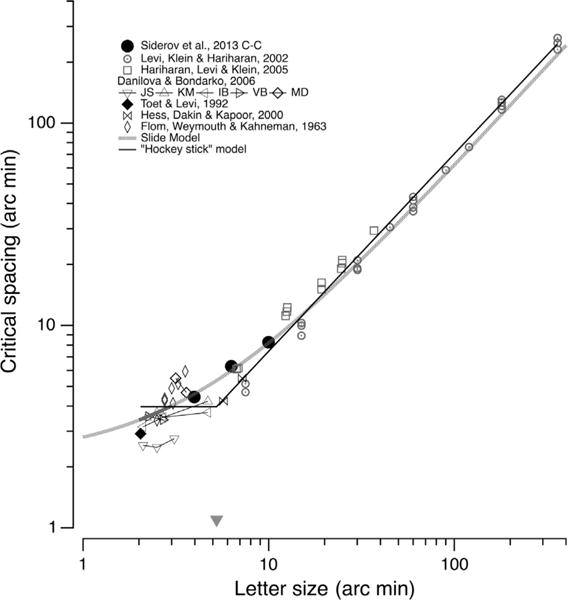
Fig. 4.

Critical spacing (CS - based on center-to-separation in minutes) vs. letter size. Solid black circles replot the critical spacings of Siderov et al., from figure. The other symbols show data from several other studies plotted in the same way. The black line shows the fit of a simple 2-mechanism model in which the critical spacing for foveal contour interaction occurs (CS0) is a small fixed spacing when the target size (S) is small (⪅ 5 arc min), and proportional to target size for S > than ≈ 5 arc min. The gray triangle near the abscissa shows CS0. The gray line is the prediction based on the analysis shown in Fig. 2 (using c–c critical separation = 0.6* (size + 3.68).
