
Figure 2.
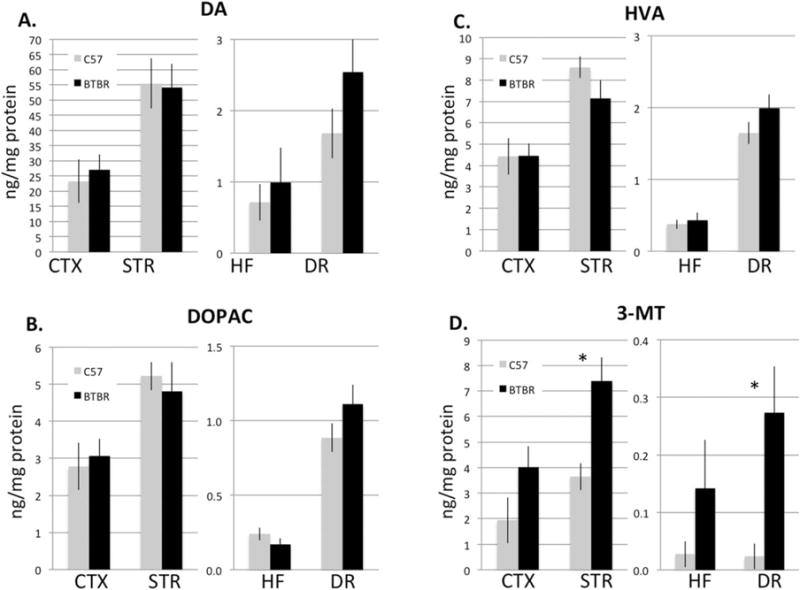
(A) Dopamine (DA) and its metabolites, (B) 3,4-dihydroxyphenylacetic acid and (C) HVA were not significantly different between C57 (grey) and BTBR mice (black) in any area. (D) However, in BTBR mice, there was significantly greater 3-metholxytyramine (3-MT) both in the STR and DR (P = 0.005 and 0.01, respectively). N = 10 per group.