


Figure 5.
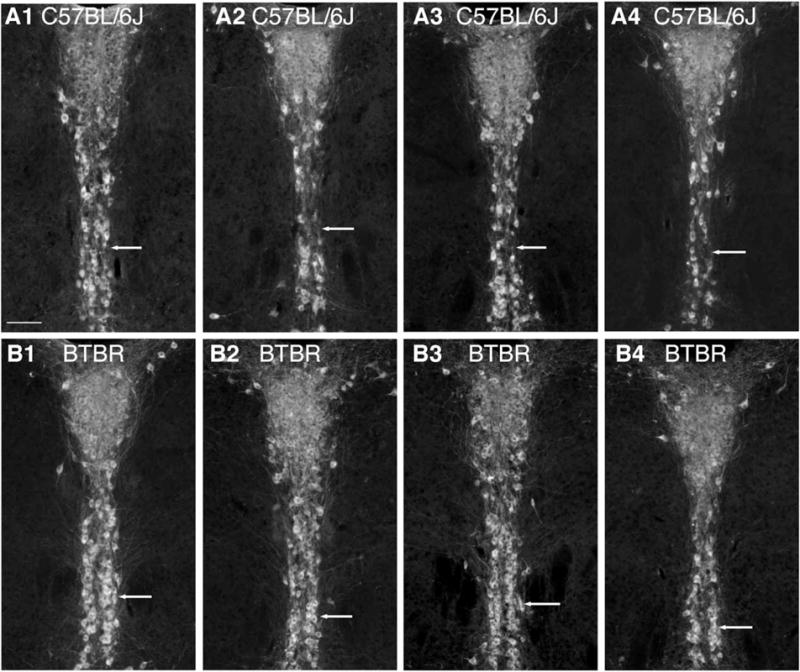
Comparison of the morphology of B6 in C57 and BTBR. A1-4 shows the same level from four different C57 mice and matched below (B1-4) are comparable images from 4 BTBR mice. Ventrally, the difference in cell number can be detected visually in that C57 mice have regions where neurons are sparse (A row, arrows) whereas in BTBR two paramedial columns of 5-HT neurons (identified by immunolabeling for TPH) are consistently visible (B row, arrows). Bar = 100 μm.