
Figure 7.
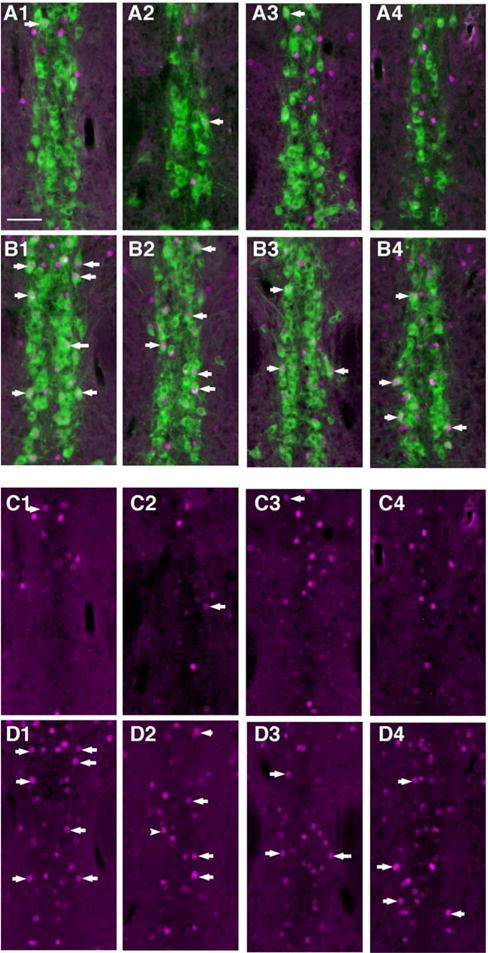
Example images of the caudal ventral DR showing BTBR mice had more 5-HT neurons with Fos-immunolabeled nuclei. Same sections as in Figure 5. (A1-4) Same level for four different C57 mice showing 5-HT neurons (green; identified by immunolabeling for TPH) and Fos (magenta) immunolabeling together. (B1-4) Comparable images from four different BTBR mice. (C1-4) Same images as in A1-4 showing Fos-immunolabeling alone, arrows point to examples of positive Fos immunolabeling within the nucleus a serotonin neuron. (D1-4) Same images as in B1-4 showing Fos only. Some of the dually labeled neurons are indicated with arrows, and these are much more prevalent in BTBR then in C57 (quantification in Fig. 6). All panels same scale; bar in A1 = 100 μm.