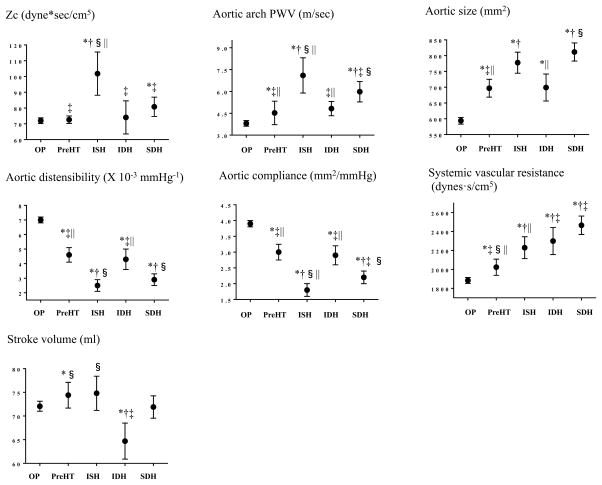
Figure 1. Cardiovascular magnetic resonance-derived measures by the categorical BP groups.
Means (95% CIs) in cardiovascular magnetic resonance-derived measures by each BP group are shown. Univariate linear regression models were used and P values were obtained by Bonferroni multiple comparison tests. Statistical significance was defined as P <0.05. *P<0.05 vs. optimal BP; †P<0.05 vs. prehypertension; ‡P<0.05 vs. ISH; §P<0.05 vs. IDH; ||P<0.05 vs. SDH.
OP indicates optimal BP; PreHT, prehypertension; ISH, isolated systolic hypertension; IDH, isolated diastolic hypertension; SDH, systolic and diastolic hypertension.

