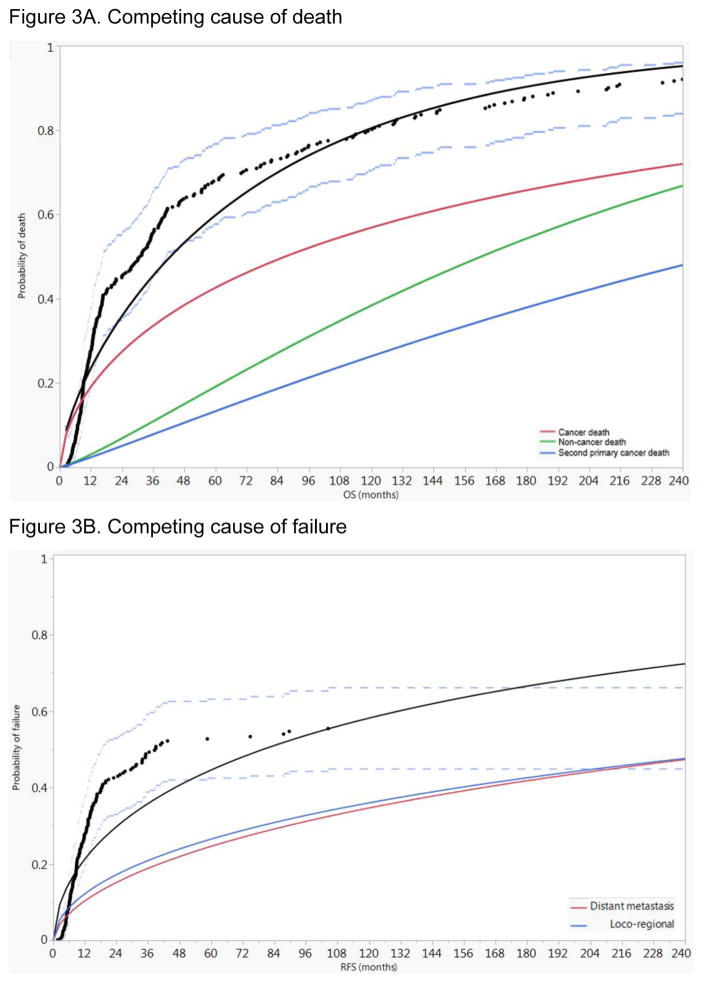
Figure 3.
Competing risk analysis for all patients A) competing risk of death cancer mortality predominates throughout the entire follow up duration, followed by non-cancer-related death and death from second primary cancer, B) competing risk of failure where loco-regional failure slightly exceeds the risk of distant metastasis. Black dots represent aggregated data points, black line represents fitted line of the aggregated data points, and dashed blue lines represent 95% confidence intervals.

