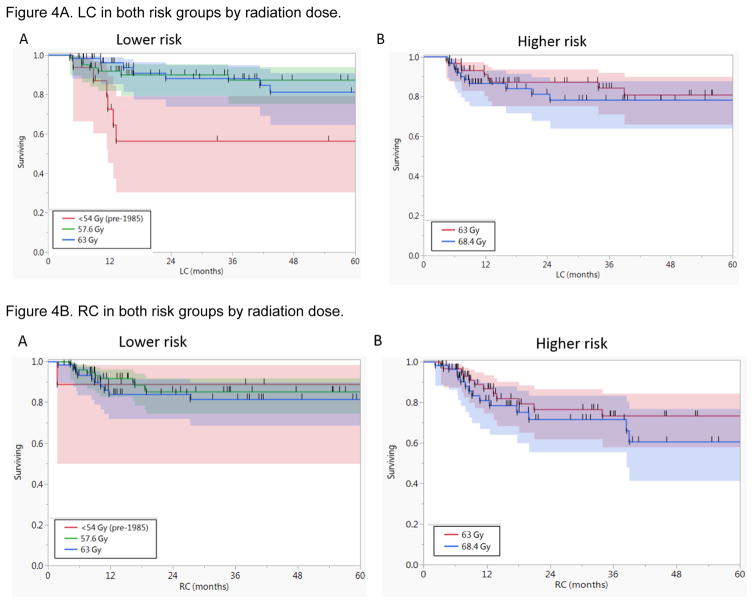
Figure 4.
Kaplan-Meier curves for A) local control (LC) in both risk groups by radiation dose, and B) regional control (RC). It shows there were no statistically significant differences in LC or RC rates between different dose levels in both the lower and higher risk groups except for LC of patients who were treated prior to 1985 with lower dose level A <54 Gy (n=17).

