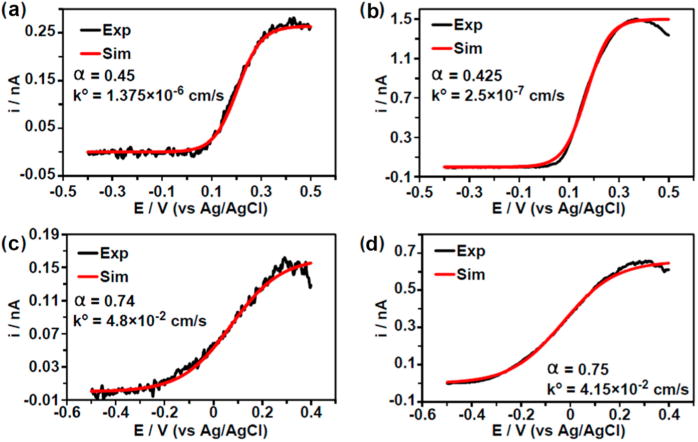
Figure 7.

Experimental CVs and their corresponding simulation from four example nanoparticles from the listed colloidal solutions: (a) 12 nm Au, (b) 50 nm Au, (c) 4 nm Pt, and (d) 30 nm Pt. Simulated CVs were obtained using the listed parameters. Only the forward scans are shown, and each experimental CV was taken at 25 V/s in 10 mM hydrazine containing 50 mM phosphate buffer (pH 7.4). Reproduced with permission ref 46. Copyright 2016 American Chemical Society.
