
Figure 2.
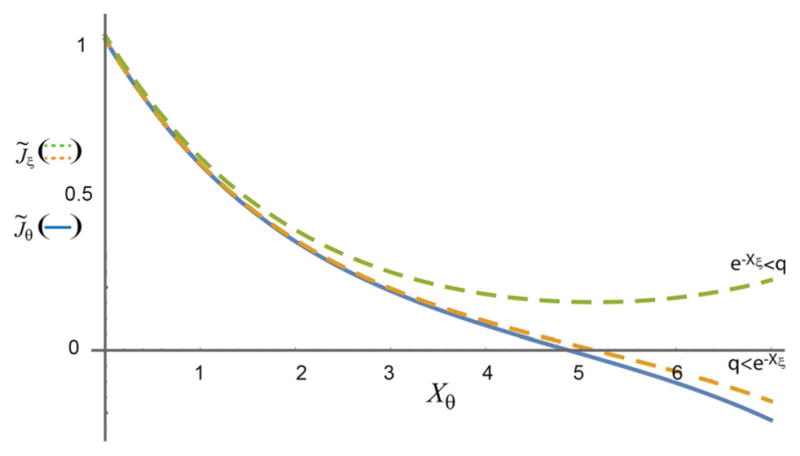
Plots of the coupled transport terms in Equation (5a) (solid blue line) and Equation (5b) (dashed lines) are shown for q = e−7 and e−Xξ = e−5 (dashed green curve) and q = e−5 and e−Xξ = e−7 (dashed orange curve) with .
Official websites use .gov
A
.gov website belongs to an official
government organization in the United States.
Secure .gov websites use HTTPS
A lock (
) or https:// means you've safely
connected to the .gov website. Share sensitive
information only on official, secure websites.
Plots of the coupled transport terms in Equation (5a) (solid blue line) and Equation (5b) (dashed lines) are shown for q = e−7 and e−Xξ = e−5 (dashed green curve) and q = e−5 and e−Xξ = e−7 (dashed orange curve) with .