
Figure 3.
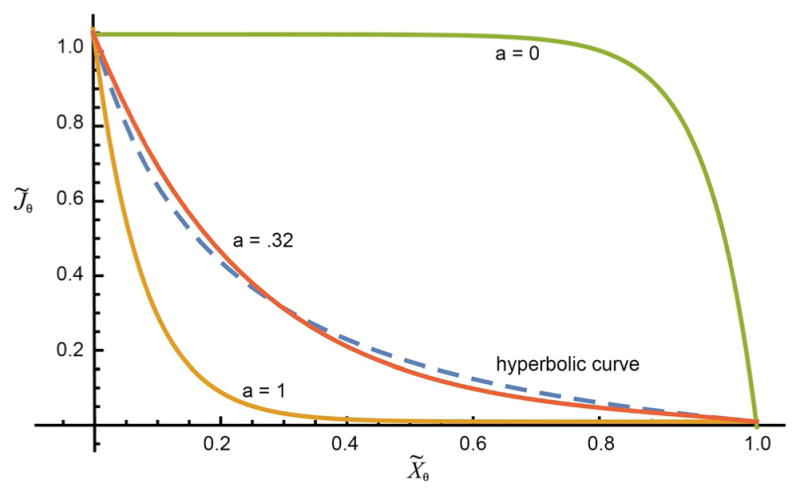
Plots of Equation (7) (solid curves) with r0 = e−13 for three different values of a. The hyperbolic curve J̃θ = K(1 − X̃θ)/(K + X̃θ) proposed by Hill, with K = 0.2 as used by Hill to fit experimental data obtained for the force versus velocity curve of muscle, is shown as the dashed blue curve.