
Figure 4.
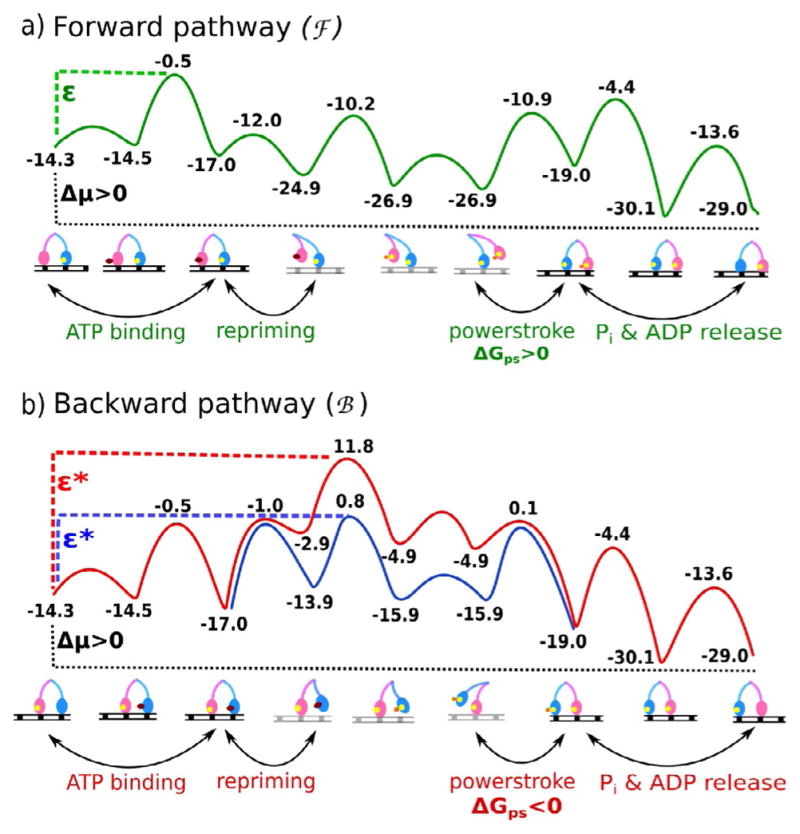
Energy profiles for the a) forward functional (plus end directed) pathway (green curve) and b) the backward (minus end directed) pathway (red or blue curves) for two-headed myosin V walking on actin are shown (adapted from ref. [35]). The computational results suggest that the “power stroke” in the forward pathway is endergonic (ΔGps>0), whereas that in the backward pathway is exergonic (ΔGps<0). The forward pathway nevertheless is strongly preferred over the backward pathway because the highest activation barrier in the backward path is much higher than the highest barrier in the forward pathway (green compared with red curve), Δε=ε−ε*. Even when one considers that the energetically costly conformational change in one leg of myosin V is compensated completely by the downhill conformational change in the other leg, still the system goes through the blue curve where ε*>ε, although Δε is much lower than that for the red curve. It should be noted that a complete and simultaneous compensation of the conformational changes in the two legs is unlikely to occur and myosin V most likely adopts a much high energy pathway for back stepping (i.e., red curve).