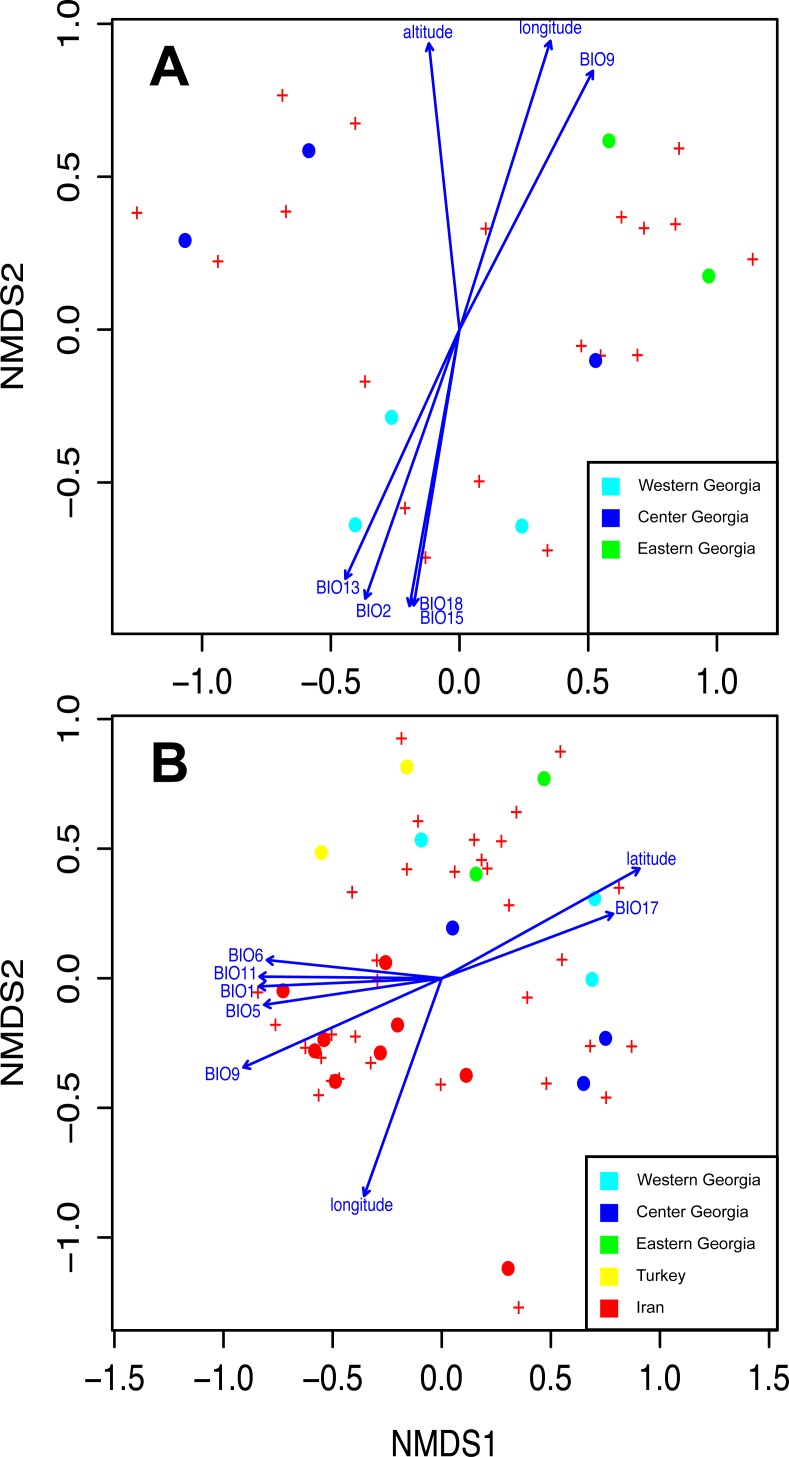
Figure 5. Non-Metric Multidimensional Scaling (NMDS) ordering the differences between EM and Frankia communities and showing the correlation with environmental and geographical parameters in Georgia (A) and at a wider scale between Georgia, Iran and Turkey for EM fungi only (B). Significant variables are represented (P > 0.05 according to environmental fitting tests; see Table S3 of Appendix S1).
BIO1, temperature seasonality; BIO2, maximum temperature of the warmest month; BIO5, precipitation of the warmest month; BIO6, precipitation of the driest month; BIO9, precipitation of the warmest quarter; BIO11, isothermality; BIO13, precipitation of the wettest quarter; BIO15, annual mean temperature; BIO17, mean temperature of the driest quarter and BIO18, precipitation of the coldest quarter.

