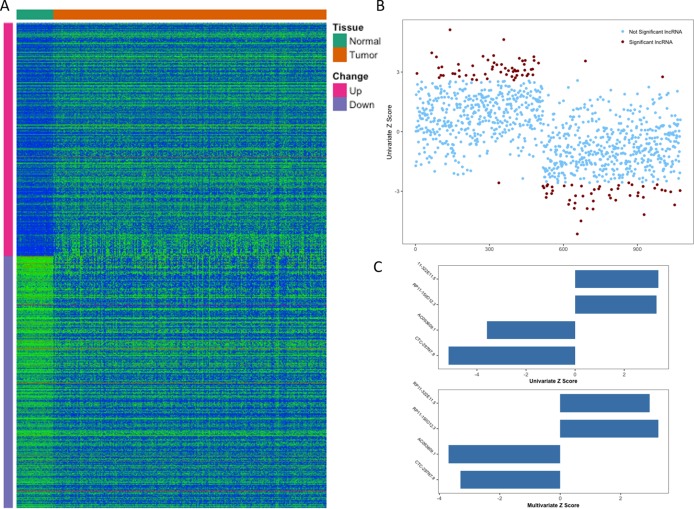
Figure 1. Identification of prognostic lncRNA for patients with HCC.
(A) Heatmap of 1,074 differentially expressed lncRNAs between normal and tumor tissues. (B) Z score of 1,074 deregulated lncRNAs from univariate Cox aggression analysis (brown dots indicate lncRNAs with p value <0.01). (C) Z score of four identified prognostic lncRNAs from univariate and multivariate Cox aggression analysis.

