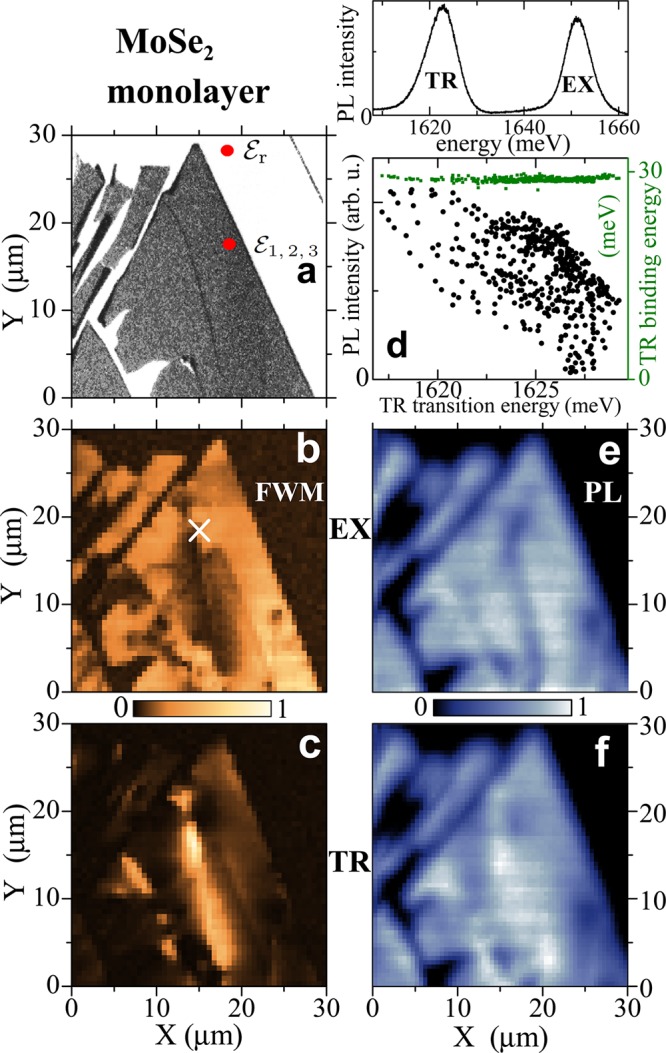
Figure 2.

Hyperspectral mapping
of the MoSe2 monolayer. (a) Optical contrast of the sample
observed in reflectance. Red dots indicate  and
and  . (b–c) Spatial imaging of the FWM amplitude, spectrally averaged
over the exciton (b) response, centered at ∼1650 meV and the
trion (c) at ∼1625 meV. Heterodyning at the FWM frequency Ω3 + Ω2 – Ω1 with τ12 = τ23 = 50 fs, T = 6 K.
(d) Top: A typical PL spectrum, nonresonantly excited at ∼1750
meV (∼710 nm) with ≃0.1 μW average power arriving
at the sample surface, displaying bright emission from EX and TR,
with integrated count rate of 350 kHz for each transition. Bottom:
Correlation between the PL intensity of the TR (black) and its binding
energy (green), as a function of its transition energy. (e–f)
PL imaging of TR and EX, respectively. Excitation conditions as in
d. Linear color scale, as shown by horizontal bars.
