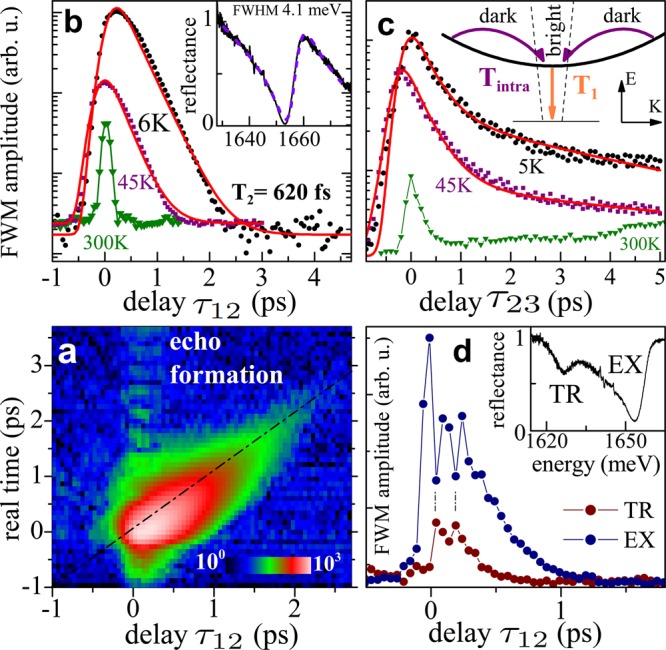
Figure 3.

Exciton dynamics in the MoSe2 monolayer inferred with FWM microscopy. (a) Time-resolved FWM amplitude as a function of τ12, showing the formation of a photon echo: a Gaussian signal with a maximum for t = τ12. Logarithmic color scale is given by the color bar. (b) FWM amplitude as a function of τ12 retrieved from the EX at T = 6, 45, and 300 K given by black circles, purple squares, and green triangles, respectively. The simulations yielding T2 ≃ 620 and 520 fs are given by red traces. Inset: reflectance measured at T = 6 K yielding 4.1 meV fwhm. (c) Cartoon of the considered radiative recombination and intravalley relaxation processes is presented in the inset. The initial dynamics of the EX population measured at 5, 45, and 300 K, color coding as in b. The results yield radiative lifetime T1 and relaxation time Tintra (see main text). (d) τ12 dependence of the FWM amplitude when simultaneously driving the EX (blue) and TR (brown) transitions, revealing a beating with 140 fs period, and thus indicating EX–TR coherent coupling. The location of the excitation is marked with a cross in Figure 2 b, while the corresponding microreflectance spectrum is given in the inset.
