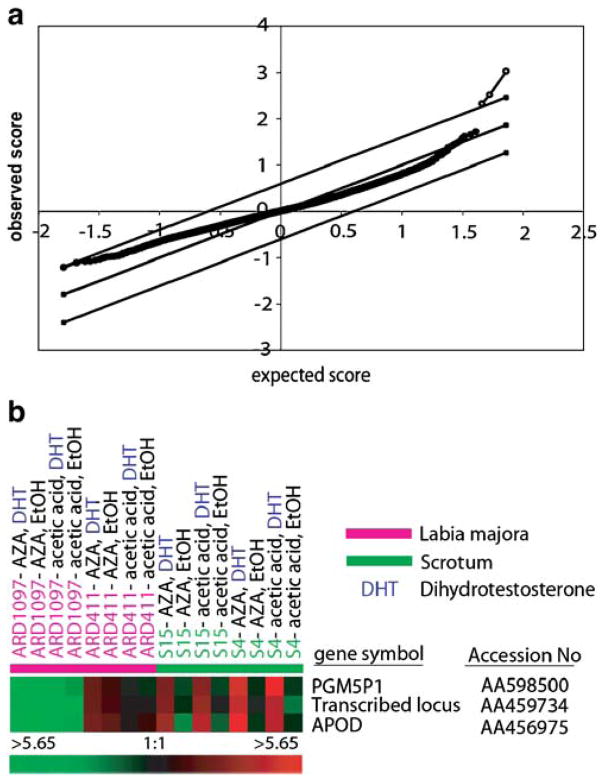
Fig. 2.
a Identification of androgen induced transcripts by significance analysis of microarrays (SAM). Plot of observed scores (Y-axis) versus expected scores (X-axis) according to [23] of DHT-induced transcripts calculated by SAM analysis on the basis of 16 microarrays in experimental set 1. The open dots represent the transcripts which are significantly induced by DHT at a false positive discovery rate of 0%. b Color-coded display of expression values of DHT- induced transcripts (experimental set 1). The rows in the heatmap show the three transcripts, APOD, PGM5P1, and the transcribed locus AA459734, which were identified to be significantly induced by DHT as measured on micro-arrays using SAM. Expression values for each transcript were centered by mean. Red–green color coding has the same meaning as in Fig. 1

