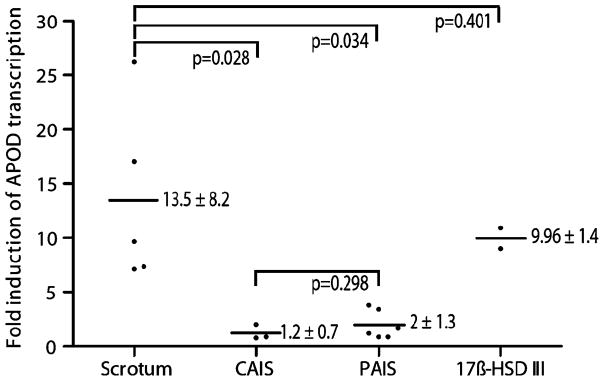
Fig. 4.
DHT-mediated induction of APOD transcription in normal male scrotum, PAIS, CAIS, and individuals with 17β-HSDIII defect (experimental set 2). The Y-axis represents the fold induction of APOD transcription. The X-axis represents the different groups of investigated cell strains. Black dots represent the APOD induction in each of the normal scrotum (five individuals), CAIS (three individuals), PAIS (six individuals), and 17β-HSDIII deficiency (two individuals) cell strains. The black lines represent the mean fold induction of APOD transcription per group based on these values

