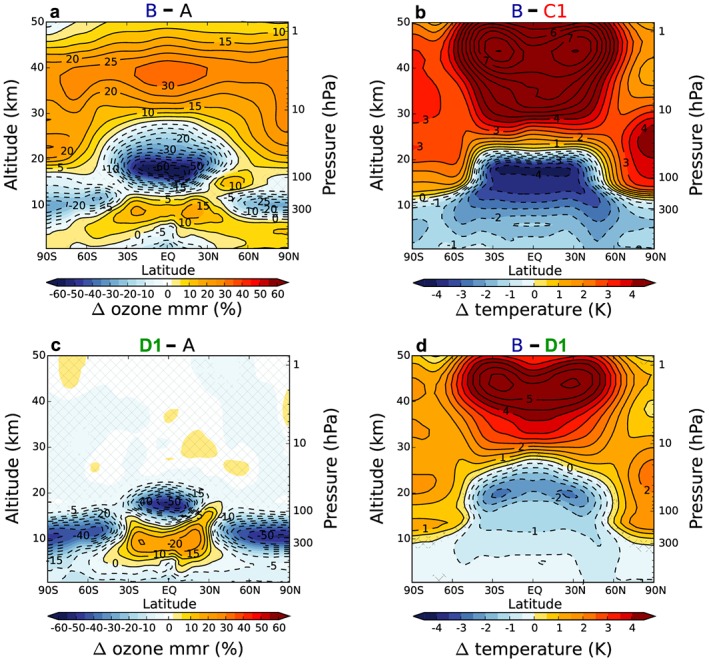
Figure 2.

Relative differences (%) in (a and c) zonal mean ozone and (b and d) absolute temperature averaged over 150 years each for the pairs of integrations (as labeled). Nonsignificant changes at the 95% confidence level (using a two‐tailed Student's t test) are hatched out. In Figures 2b and 2d, the color scale is constrained to highlight the changes around the tropical tropopause, while the contour lines show the full extent of all changes as 0.5 K intervals. Corresponding differences for C2 and D2 are given in the supporting information Figure S2.
