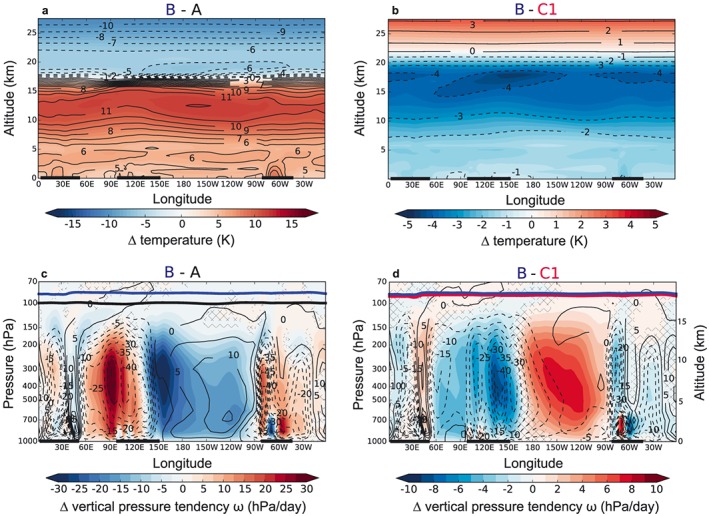
Figure 3.

The 5N–5S averages. (a and b) Absolute temperature differences (K). (c and d) Differences in air parcel pressure tendencies ω (hPa/d, shaded) and absolute ω (contours) from A in Figure 3c and from B in Figure 3d. Annual mean tropopause heights are indicated in corresponding colors. Nonsignificant changes (using a two‐tailed Student's t test at the 95% confidence level) are hatched out in Figures 3c and 3d.
