
Figure 3. Biaxial analysis of cells derived from human tissue and tumors.
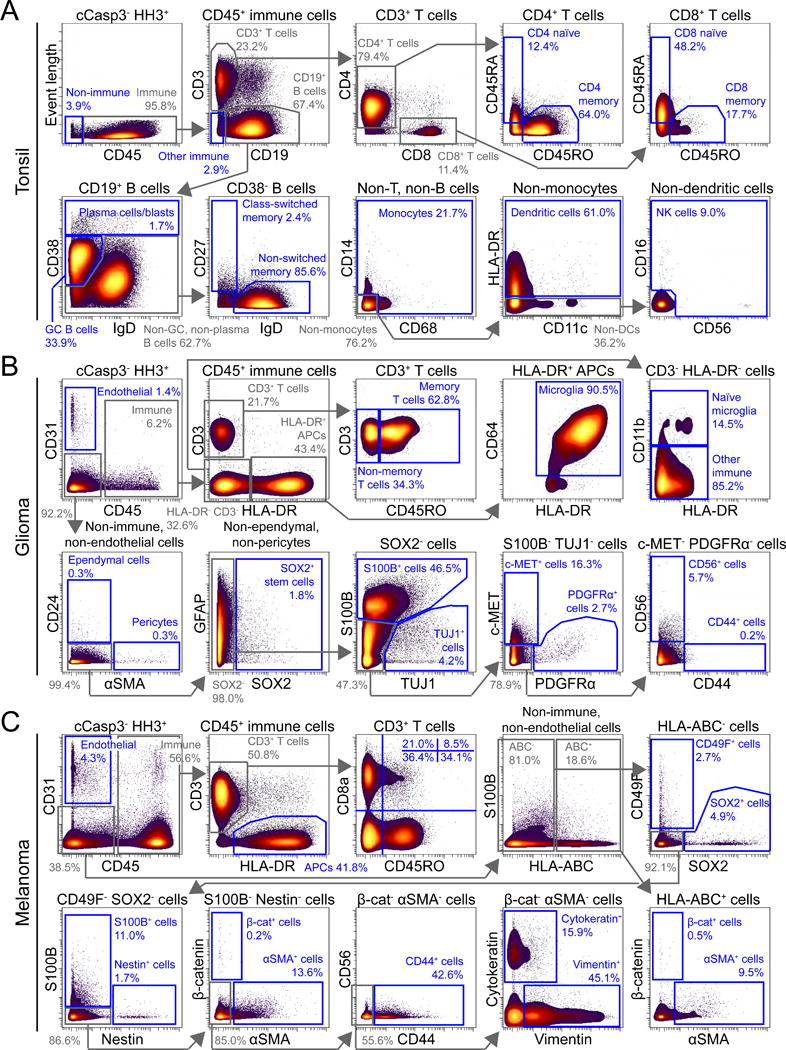
Biaxial plots of non-apoptotic (cCasp3−), nucleated (HH3+) cells from mass cytometry analysis of (A) tonsil, (B) glioma, and (C) melanoma are shown. Intermediate gates are shown in grey, and terminal gates are shown in blue. Cell types or protein identity of cells in each gate are indicated. The percentages of cells in gates are also specified.