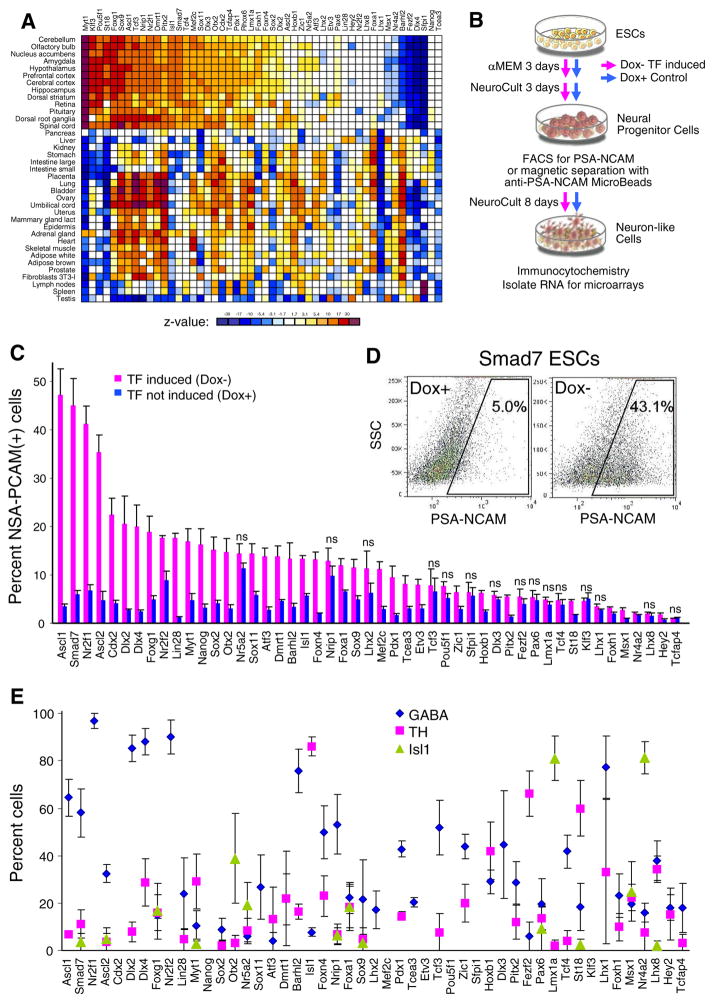
Figure 1.
Induction of transcription factors (TFs) and its effect on the transcriptome and neural differentiation of ESCs. (A) Correlation of gene expression response to the induction of transcription factors (Nishiyama et al. 2009, Correa-Cerro et al. 2012, Yamamizu et al. 2016) with tissue-specific gene expression from the GNF ver. 3 database (Su et al. 2002, Wu et al. 2009); color shows z value for correlation significance, white non-significant correlation (z < 2). (B) Scheme of ESC differentiation experiment: To activate the transgenic TF, Dox was removed from the media. Cells were cultured for 3 d in αMEM and 3 d in NeuroCult medium, followed by FACS or cell enrichment by beads. For full differentiation, cells were cultured for 8 more days in NeuroCult medium and then used for immunostaining and gene expression profiling with micro-arrays. (C) Percent PSA-NCAM(+) cells identified by FACS on day 6 of neural differentiation of ESC clones with 49 individual tetracycline-repressible transgenic TFs (horizontal axis); error bars (SE) were determined from three replications; ns non-significant difference between cells cultured in Dox− and Dox+ conditions. (D) Example of FACS image used for determining the percent PSA-NCAM(+) cells. (E) Proportion of cells with GABA, TH, and ISL1/2 immunostaining among TUJ1-positive cells derived by induction of various TFs (horizontal axis) on day 14.

