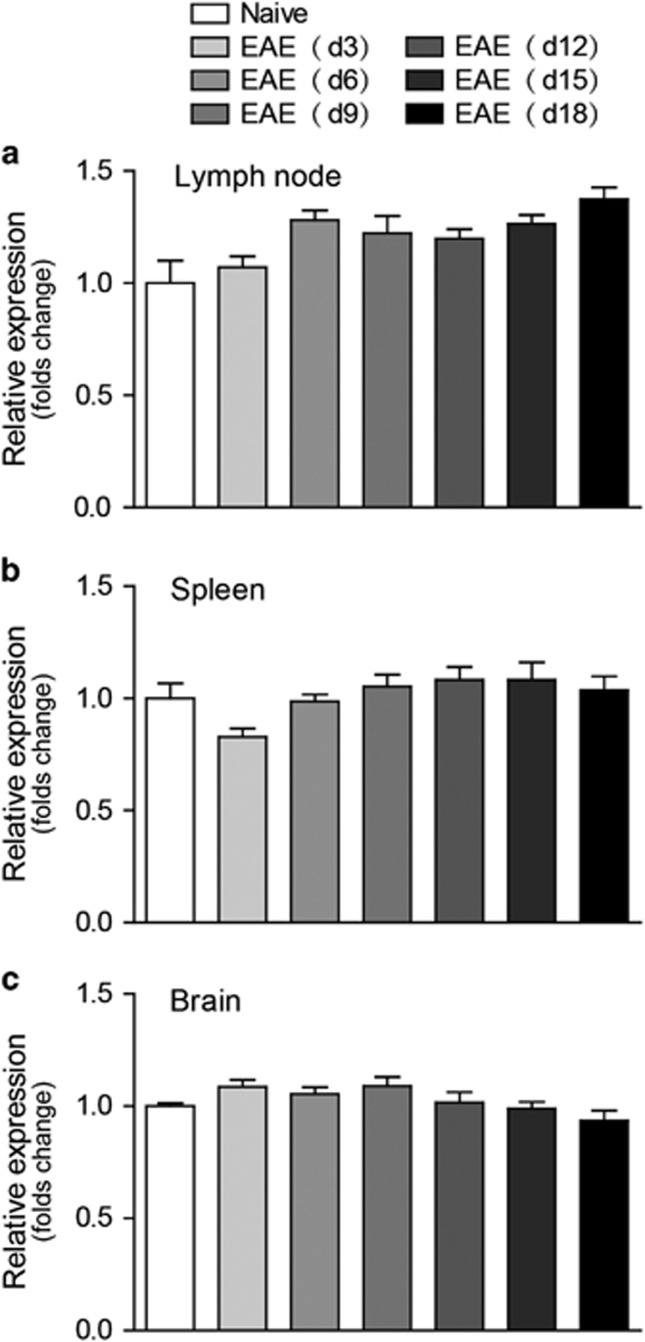
Figure 1.
Expression profile of Gαq in the peripheral immune tissues and central nervous system during EAE pathogenesis. Total RNA was isolated from the spleen, lymph nodes and brains of naive controls and EAE mice on days 3, 6, 9, 12, 15, and 18 post immunization. qPCR was performed to analyze gene expression. The expression was normalized to relative β-actin and then to the expression of the control. (a–c) Relative expression level of Gαq in lymph nodes (a), spleen (b) and brain (c). The data are expressed as the mean±s.e.m. (n=6).

