Figure 1.
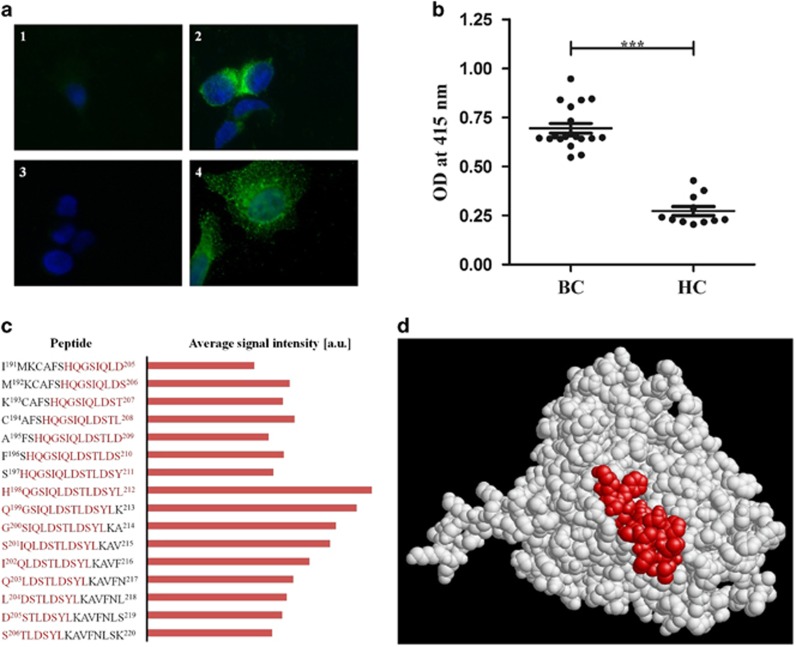
(a) Detection of CYP4Z1 on the outer surface of non-permeabilized MCF-7 cells by rabbit anti-CYP4Z1 IgG and by aAbs from a breast cancer patient serum. Non-permeabilized MCF-7 cells were probed with antibodies as indicated below and stained with DAPI. Fluorescence was detected on a Eclipse E600 microscope (Nikon) using exposure times of 80 ms for DAPI and 2 s for FITC, respectively. Magnification is × 1000 for all images. The images correspond to: (1) MCF-7 cells exposed to secondary anti-rabbit Ab (goat anti-rabbit IgG conjugated to Alexa fluor 488; 1:2000) only; (2) MCF-7 cells probed with rabbit anti-CYP4Z1 Ab (1:1000) and secondary anti-rabbit Ab (as in 1); (3) MCF-7 cells exposed to secondary anti-human Ab (goat anti-human IgG conjugated to Alexa fluor 488; 1:2000) only; (4) MCF-7 cells probed with human breast cancer serum (1:500) and secondary anti-human Ab (as in 3). Breast cancer serum samples used in this study were from female breast cancer patients of the Tianjin Medical University Cancer Institute and Hospital, while control serum samples were from female patients of the Tianjin University Hospital with no malignancies. All patients gave written, informed consent under a study protocol approved by the institutional ethics committees. (b) ELISA assay detected higher titers of anti-CYP4Z1 aAbs in breast cancer patients’ sera. Recombinant CYP4Z1 full-length protein was used to coat an ELISA plate. Wells were incubated with sera from breast cancer patients (BC; n=19) or healthy controls (HC; n=11), respectively. The average of all samples in each group is displayed by the dark line, with error bars representing the s.e.m. for each group (P<0.0001). (c) Comparison of aAb binding to peptides in the vicinity of amino acids 198–212 of CYP4Z1. High-resolution epitope mapping of five patient sera was done by PreMed Biotech Co. Ltd. (Beijing, China) using 15-mer peptides covering the entire CYP4Z1 sequence with an offset of one amino acid. For each patient sera, signal intensities were normalized with respect to the peptide giving the highest intensity; from these, data averages were calculated and plotted in arbitrary units. Shown are the peptide sequences and average signal intensities for peptides number 198–213. Amino acids His-198 to Leu-212 (which constitute peptide number 205) are highlighted in red. (d) Localization of amino acids His-198 to Leu-212 on the surface of CYP4Z1. We recently published a homology model of CYP4Z1 on the basis of the X-ray structure of human CYP3A4 as a template.8 The graph shows this structure with amino acids His-198 to Leu-212 highlighted in red.

