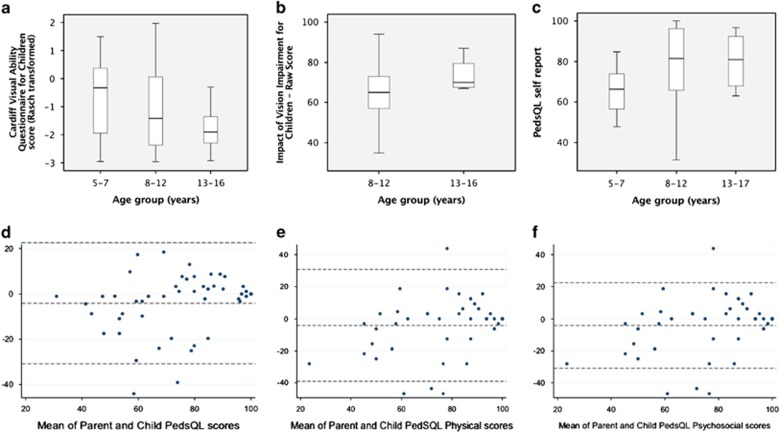
Figure 2.
Top: Box plots of median and interquartile range (IQR) Cardiff Visual Ability for Children (a), Impact of Vision Impairment for Children (b), and PedsQL self-report scores (c) of children with cataract. There is a trend towards less impairment with increasing age (decreasing scores on CVAQC, increasing scores on IVI-C and PedsQL), but with large overlap of the IQR. Bottom: Bland–Altman plots of agreement between parent and child PedsQL scores; x axis: mean of parent and child scores; y axis: difference of parent and child scores. Parents report lower overall scores than their children; the lower the scores, the larger the disagreement (d). The plot for physical and psychosocial PedsQL subscores shows no systematic bias (e), but parents tended to report lower scores than their children on the psychosocial scale (f).

