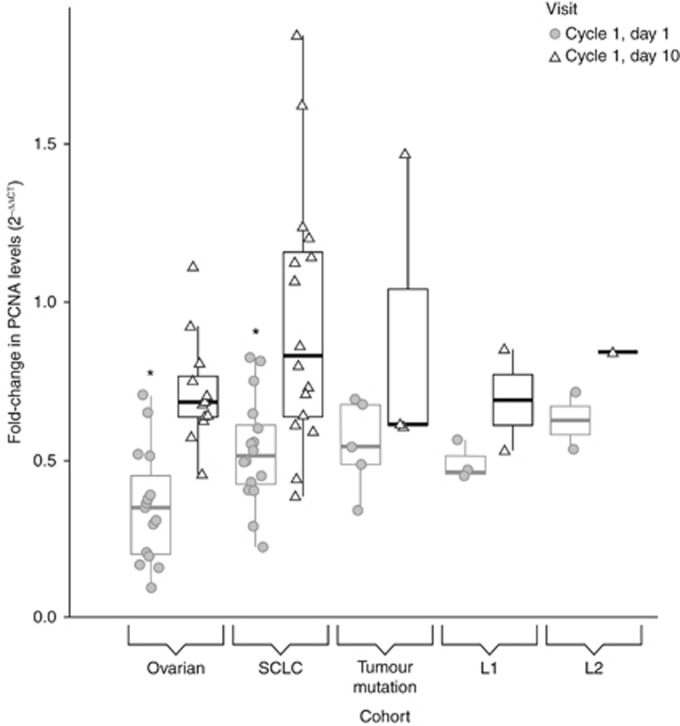
Figure 4.
Changes of PCNA expression levels in whole blood after roniciclib treatment. The boxplot shows the fold-change of PCNA RNA expression on day 1 (circle) and day 10 (triangle) of cycle 1 compared with baseline values for each cohort. Significant changes to baseline values are depicted by asterisks. Cycle 1, day 1 values for both the ovarian cancer and SCLC cohorts are significantly different from baseline PCNA expression. The thick black line in the box indicates the median value, the upper hinge indicates the 75% quantile, and the lower hinge indicates the 25% quantile. Upper and lower whiskers describe the largest or smallest observed values within 1.5-fold of the interquantile range.

